May 16, 2026 a 07:31 am

MRK: Dividend Analysis - Merck & Co., Inc.
Merck & Co., Inc. presents a robust dividend profile with a consistent history of payouts over the past 57 years, reflecting fiscal discipline and shareholder value emphasis. Despite a high EPS payout ratio, the firm maintains moderate dividend growth, indicative of its stability in turbulent markets. Close monitoring of this factor, along with other financial metrics, is essential for prospective investors.
📊 Overview
Merck & Co., Inc. operates in the pharmaceutical sector, exhibiting a dividend yield of 2.88% and a committed dividend payment history of 57 years. Its current dividend per share stands at $3.27, with no recent cuts or suspensions.
| Aspect | Detail |
|---|---|
| Sector | Pharmaceuticals |
| Dividend Yield | 2.88% |
| Current Dividend per Share | $3.27 |
| Dividend History | 57 years |
| Last Cut or Suspension | None |
🗣️ Dividend History
Merck's dividend history highlights a record of consistency and resilience, with uninterrupted distributions over several decades. This track record underpins investor confidence and illustrates the company's relative financial stability.
| Year | Dividend per Share (USD) |
|---|---|
| 2026 | 0.85 |
| 2025 | 3.28 |
| 2024 | 3.12 |
| 2023 | 2.96 |
| 2022 | 2.80 |
📈 Dividend Growth
Evaluating dividend growth is crucial in assessing the potential return on investment. Over the past three years, Merck & Co., Inc. recorded a growth rate of 5.42%, whereas over five years, the growth rate was 6.75%.
| Time | Growth |
|---|---|
| 3 years | 5.42% |
| 5 years | 6.75% |
The average dividend growth is 6.75% over five years. This shows moderate but steady dividend growth.
✅ Payout Ratio
The payout ratios offer insight into the dividend sustainability concerning earnings and cash flow. A payout ratio based on EPS at 90.41% suggests a significant portion of earnings is distributed as dividends. The cash flow-based ratio is 57.18%, indicating dividends are adequately covered by free cash flow, reducing risk of reduction in bear markets.
| Key figure | Ratio |
|---|---|
| EPS-based | 90.41% |
| Free cash flow-based | 57.18% |
⚙️ Cashflow & Capital Efficiency
Analyzing cash flow and capital efficiency is crucial for understanding underlying performance and potential future growth. Merck & Co., Inc. presents the following metrics over recent fiscal years:
| Year | 2025 | 2024 | 2023 |
|---|---|---|---|
| Free Cash Flow Yield | 4.69% | 7.18% | 3.22% |
| Earnings Yield | 6.93% | 6.80% | 0.13% |
| CAPEX to Operating Cash Flow | 24.96% | 15.71% | 29.70% |
| Stock-based Compensation to Revenue | 0% | 1.19% | 1.07% |
| Free Cash Flow / Operating Cash Flow Ratio | 75.04% | 84.29% | 70.30% |
The current cash flow performance, while fluctuating, suggests a stable base for financial maneuvering and capital investment, but requires persistent evaluation to ensure enduring efficiency and adequacy.
📉 Balance Sheet & Leverage Analysis
Key financial ratios offer a transparent view of Merck & Co., Inc.'s financial leverage and stability. These insights help predict the company's capability to meet long-term obligations:
| Year | 2025 | 2024 | 2023 |
|---|---|---|---|
| Debt-to-Equity Ratio | 0.96 | 0.83 | 0.97 |
| Debt-to-Assets Ratio | 0.37 | 0.33 | 0.34 |
| Debt-to-Capital Ratio | 0.49 | 0.45 | 0.49 |
| Net Debt to EBITDA | 1.23 | 0.97 | 4.26 |
| Current Ratio | 1.54 | 1.36 | 1.25 |
| Quick Ratio | 1.30 | 1.15 | 1.00 |
| Financial Leverage | 2.60 | 2.53 | 2.84 |
These measures suggest a duly managed leverage level, indicating sound financial health under current operating conditions, albeit requiring vigilance owing to variations in EBITDA coverage.
🌟 Fundamental Strength & Profitability
Reviewing fundamental metrics is vital to appraise Merck & Co., Inc.'s profitability and efficiency. Over the last few years, the performance metrics demonstrate:
| Year | 2025 | 2024 | 2023 |
|---|---|---|---|
| Return on Equity | 34.70% | 36.96% | 0.97% |
| Return on Assets | 13.33% | 14.62% | 0.34% |
| Net Margin | 28.12% | 26.68% | 0.61% |
| EBIT Margin | 36.17% | 33.05% | 5.05% |
| EBITDA Margin | 45.17% | 40.06% | 11.49% |
| Gross Margin | 71.98% | 76.32% | 73.17% |
| Research & Development to Revenue | 19.27% | 27.95% | 50.79% |
Merck exhibits proficient operational metrics, indicating efficient cost management and strategic R&D investments, particularly notable in higher relative gross and EBITDA margins.
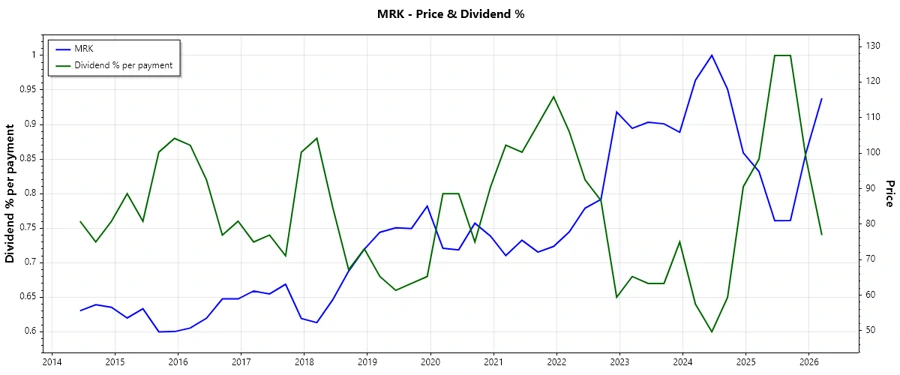
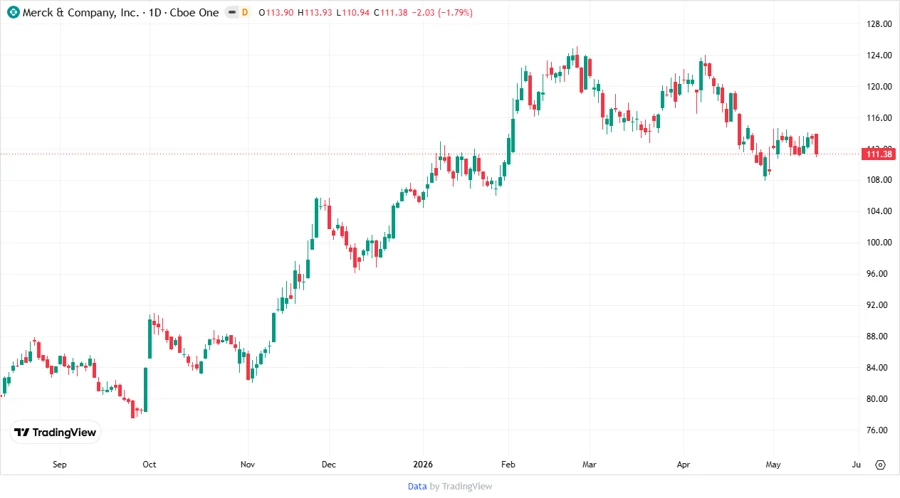
📈 Price Development
🔍 Dividend Scoring System
This section assesses Merck & Co., Inc.'s dividend performance across key criteria:
| Criteria | Score | |
|---|---|---|
| Dividend Yield | 3 | |
| Dividend Stability | 5 | |
| Dividend Growth | 3 | |
| Payout Ratio | 2 | |
| Financial Stability | 4 | |
| Dividend Continuity | 5 | |
| Cashflow Coverage | 4 | |
| Balance Sheet Quality | 4 |
Total Score: 30/40
Final Rating
In conclusion, Merck & Co., Inc. offers a compelling dividend profile, underscored by consistent payouts and a stable financial footing. However, the high EPS payout ratio necessitates prudent monitoring. While dividend growth remains moderate, the company's robust cash flow coverage and balance sheet quality render it a reliable option for income-seeking investors. We recommend a cautious but optimistic stance on Merck & Co., Inc.'s dividend potential.
Smart Data Insight
Master the Perfect Entry & Exit for this Stock
Don't leave your profits to chance. Historically, this stock follows specific seasonal patterns that institutional traders use to maximize returns.
- ✅ Identify the "Golden Buying Window"
- ✅ Avoid high-risk correction cycles
- ✅ Backtested data from the last 20+ years