October 19, 2025 a 03:31 pm

MRK: Dividend Analysis - Merck & Co., Inc.
Merck & Co., Inc. has exhibited a commendable track record in maintaining a robust dividend yield of 4%. With a dividend history spanning 56 years and no recent cuts or suspensions, Merck showcases stability amid volatile markets. The company's payout ratios suggest a sustainable approach to dividend payouts while balancing growth and returns.
📊 Overview
Merck operates within a stable sector, showcasing resilience with a substantial dividend yield and a long-standing history of consistent payments.
| Aspect | Detail |
|---|---|
| Sector | Healthcare |
| Dividend Yield | 4.00% |
| Current Dividend per Share | 3.10 USD |
| Dividend History | 56 years |
| Last Cut or Suspension | None |
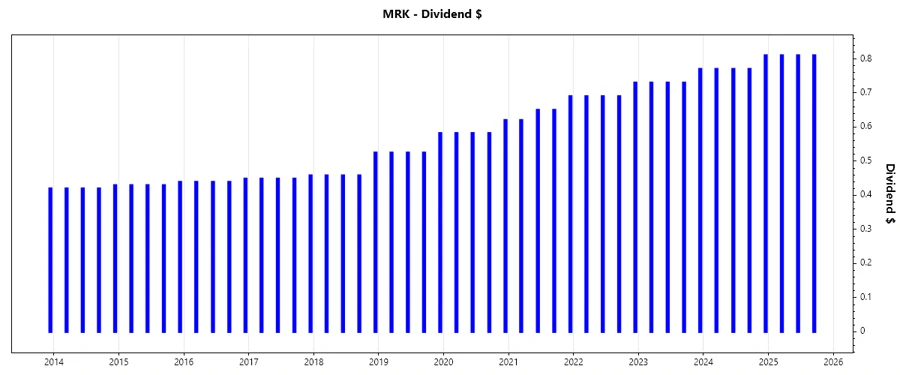
📈 Dividend History
The extended duration of dividend consistency highlights significant value for long-term investors, with dividends acting as a reliable source of income.
| Year | Dividend per Share (USD) |
|---|---|
| 2025 | 2.43 |
| 2024 | 3.12 |
| 2023 | 2.96 |
| 2022 | 2.80 |
| 2021 | 2.61 |
📈 Dividend Growth
Analysis of dividend growth rates provides insight into the company's commitment to enhancing shareholder returns. A steady growth path depicts confidence in sustained earnings performance.
| Time | Growth |
|---|---|
| 3 years | 6.13% |
| 5 years | 7.67% |
The average dividend growth is 7.67% over 5 years. This shows moderate but steady dividend growth.
⚖️ Payout Ratio
Payout ratios are crucial indicators of dividend sustainability, measuring the proportion of earnings paid out as dividends.
| Key Figure | Ratio |
|---|---|
| EPS-based | 47.24% |
| Free Cash Flow-based | 52.53% |
A payout ratio of 47.24% based on EPS and 52.53% based on FCF suggests a balanced approach, maintaining room for reinvestment and financial stability.
📈 Cashflow & Capital Efficiency
The capability to generate ample free cash flow and effective capital allocation are vital for sustaining growth and financial health.
| Metric | 2022 | 2023 | 2024 |
|---|---|---|---|
| Free Cash Flow Yield | 5.24% | 3.22% | 7.18% |
| Earnings Yield | 5.17% | 0.13% | 6.80% |
| CAPEX to Operating Cash Flow | 22.98% | 29.70% | 15.71% |
| Stock-based Compensation to Revenue | 0.91% | 1.07% | 1.19% |
| Free Cash Flow / Operating Cash Flow Ratio | 77.02% | 70.30% | 84.29% |
These cashflow metrics reflect a robust financial strategy focused on efficient capital management and reinvestment in growth opportunities.
📈 Balance Sheet & Leverage Analysis
A comprehensive understanding of leverage ratios aids in evaluating a company's capability to manage debts and financial obligations.
| Metric | 2022 | 2023 | 2024 |
|---|---|---|---|
| Debt-to-Equity | 0.70 | 0.97 | 0.83 |
| Debt-to-Assets | 0.29 | 0.34 | 0.33 |
| Debt-to-Capital | 41.02% | 49.11% | 45.25% |
| Net Debt to EBITDA | 0.91 | 4.26 | 0.97 |
| Current Ratio | 1.47 | 1.25 | 1.36 |
| Quick Ratio | 1.23 | 1.00 | 1.15 |
| Financial Leverage | 2.37 | 2.84 | 2.53 |
Merck's financial leverage and debt ratios indicate a well-managed debt portfolio, enhancing financial flexibility.
📈 Fundamental Strength & Profitability
Metrics such as return on equity and profit margins are indicative of lucrativeness and operational efficacy.
| Metric | 2022 | 2023 | 2024 |
|---|---|---|---|
| Return on Equity | 31.57% | 0.97% | 36.96% |
| Return on Assets | 13.30% | 0.34% | 14.62% |
| Margins: Net | 24.49% | 0.61% | 26.68% |
| Gross | 70.63% | 73.17% | 76.32% |
| EBIT | 29.36% | 5.05% | 33.05% |
| EBITDA | 35.95% | 11.49% | 40.06% |
| Research & Development to Revenue | 22.85% | 50.79% | 27.95% |
High margins and commendable returns on equity and assets affirm Merck's strong profitability and operational strength.
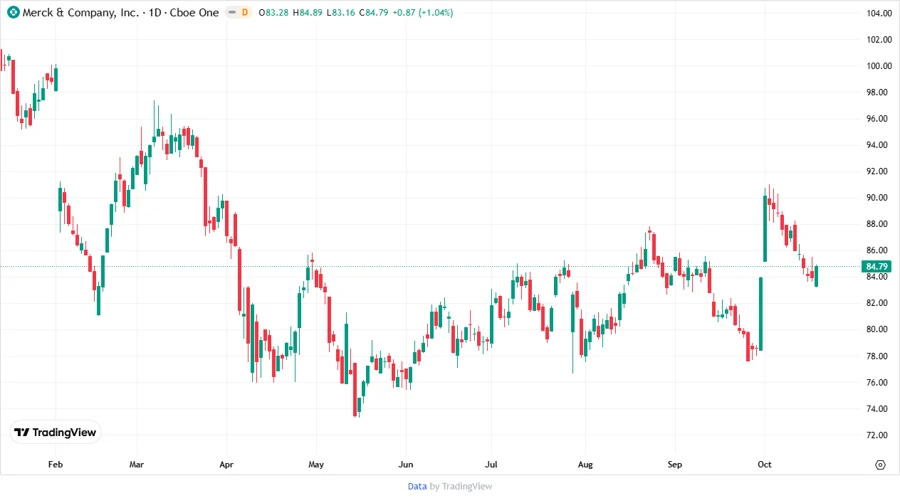
Price Development
✅ Dividend Scoring System
| Category | Score | Indicator |
|---|---|---|
| Dividend Yield | 4 | |
| Dividend Stability | 5 | |
| Dividend Growth | 4 | |
| Payout Ratio | 4 | |
| Financial Stability | 5 | |
| Dividend Continuity | 5 | |
| Cashflow Coverage | 4 | |
| Balance Sheet Quality | 4 |
Overall Score: 35/40
🌟 Rating
In conclusion, Merck & Co., Inc. presents as a strong candidate for dividend investors, with stable yields and a solid history of payouts. The company exhibits strong financial metrics and sustained growth potential, warranting a favorable recommendation for portfolio inclusion.