August 06, 2025 a 07:47 am


MRK: Dividend Analysis - Merck & Co., Inc.
Merck & Co., Inc. exhibits a robust dividend profile with a steady track record of 56 years of dividend history. The current dividend yield stands at a competitive 4.01%, reflecting the company's commitment to shareholder returns. Despite a moderate growth rate in its dividends, the consistency and reliability make it a favorable option for income-seeking investors. The payout ratios indicate a healthy balance between rewarding shareholders and maintaining financial stability.
📊 Overview
The overview of Merck & Co., Inc. highlights the following key dividend figures and sector classification, providing a snapshot of its dividend status.
| Detail | Value |
|---|---|
| Sector | Healthcare |
| Dividend yield | 4.01 % |
| Current dividend per share | 3.10 USD |
| Dividend history | 56 years |
| Last cut or suspension | None |
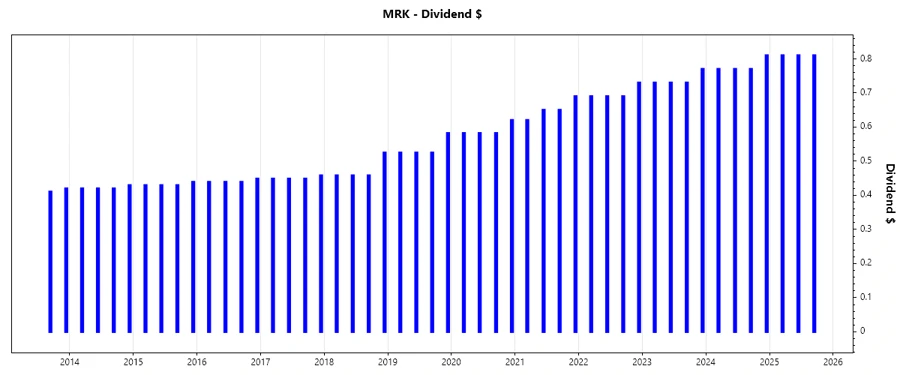
🗣️ Dividend History
Merck & Co., Inc. has consistently paid dividends for 56 years without any recent cuts or suspensions. This showcases the company's commitment to shareholders and its ability to generate steady cash flow for distributions. For dividend growth investors, this history offers confidence in future payouts.
| Year | Dividend per Share (USD) |
|---|---|
| 2025 | 2.43 |
| 2024 | 3.12 |
| 2023 | 2.96 |
| 2022 | 2.80 |
| 2021 | 2.61 |
📈 Dividend Growth
Dividend growth rates are essential for evaluating the long-term return potential of investments. Merck & Co., Inc. has shown moderate dividend growth over recent years, maintaining a steady increase that indicates stable financial health and future growth prospects.
| Time | Growth |
|---|---|
| 3 years | 6.13 % |
| 5 years | 7.67 % |
The average dividend growth is 7.67% over 5 years. This shows moderate but steady dividend growth.
⚠️ Payout Ratio
Payout ratios provide insights into how much of earnings and free cash flow are distributed as dividends, indicating sustainability and potential for increases.
| Key figure | Ratio |
|---|---|
| EPS-based | 44.95 % |
| Free cash flow-based | 45.63 % |
The payout ratios suggest a balanced approach, with around 45% of both EPS and FCF being returned to shareholders. This indicates the company is well-positioned to maintain its dividend and potentially increase it in the future.
💰 Cash Flow & Capital Efficiency
Efficient cash flow and capital allocation are crucial for maintaining and growing dividends. Merck & Co., Inc. demonstrates strong free cash flow generation, which is pivotal for covering dividend payments and reinvesting in the business.
| Year | 2022 | 2023 | 2024 |
|---|---|---|---|
| Free Cash Flow Yield | 5.24 % | 3.22 % | 7.18 % |
| Earnings Yield | 5.17 % | 0.13 % | 6.80 % |
| CAPEX to Operating Cash Flow | 22.98 % | 29.70 % | 15.71 % |
| Stock-based Compensation to Revenue | 0.91 % | 1.07 % | 1.19 % |
| Free Cash Flow / Operating Cash Flow Ratio | 77.02 % | 70.30 % | 84.29 % |
The cash flow and capital efficiency metrics highlight robust free cash flow generation and responsible capital expenditure, underscoring Merck & Co., Inc.'s strong financial footing and ability to maintain healthy dividend payouts.
🧾 Balance Sheet & Leverage Analysis
A solid balance sheet with manageable leverage is vital for sustaining dividend payments and corporate stability.
| Year | 2022 | 2023 | 2024 |
|---|---|---|---|
| Debt-to-Equity | 66.73 % | 93.28 % | 80.13 % |
| Debt-to-Assets | 28.12 % | 32.86 % | 31.69 % |
| Debt-to-Capital | 40.02 % | 48.26 % | 44.48 % |
| Net Debt to EBITDA | 0.84 | 4.08 | 0.92 |
| Current Ratio | 1.47 | 1.25 | 1.36 |
| Quick Ratio | 1.23 | 1.00 | 1.15 |
| Financial Leverage | 2.37 | 2.84 | 2.53 |
The company's balance sheet displays a prudent leverage strategy with adequate liquidity, ensuring operational flexibility and continued dividend capacity.
🏢 Fundamental Strength & Profitability
Profitability measures and strategic investments reflect Merck & Co., Inc.'s capacity to generate returns and distribute dividends.
| Year | 2022 | 2023 | 2024 |
|---|---|---|---|
| Return on Equity | 31.57 % | 0.97 % | 36.96 % |
| Return on Assets | 13.30 % | 0.34 % | 14.62 % |
| Margins: Net | 24.49 % | 0.61 % | 26.68 % |
| Margins: EBIT | 29.36 % | 5.05 % | 33.05 % |
| Margins: EBITDA | 35.95 % | 11.49 % | 40.06 % |
| Margins: Gross | 70.63 % | 73.17 % | 76.32 % |
| R&D to Revenue | 22.85 % | 50.79 % | 27.95 % |
Merck & Co., Inc.'s strong profit margins and returns on equity demonstrate its ability to reward shareholders through consistent and potentially increasing dividends.
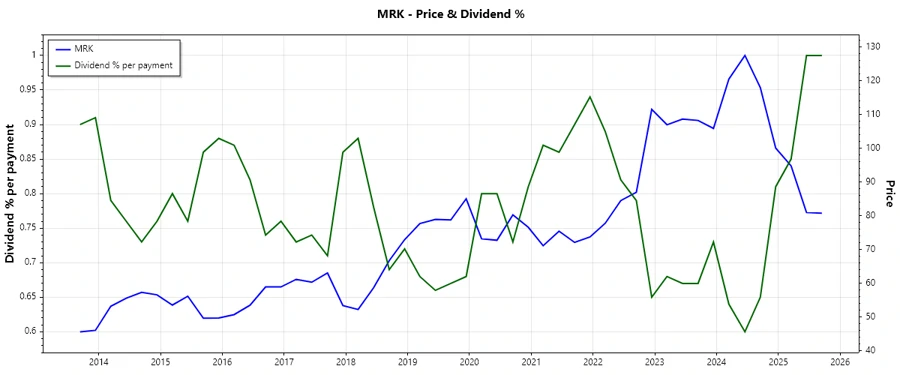
📉 Price Development
Recent price developments are showcased below, illustrating the stock’s market performance over time.
✅ Dividend Scoring System
The following sections evaluate Merck & Co., Inc.'s dividend attributes, each scored to depict overall dividend quality and stability.
| Criteria | Score | Score Bar |
|---|---|---|
| Dividend yield | 4 | |
| Dividend Stability | 5 | |
| Dividend growth | 3 | |
| Payout ratio | 4 | |
| Financial stability | 4 | |
| Dividend continuity | 5 | |
| Cashflow Coverage | 4 | |
| Balance Sheet Quality | 4 |
Total Score: 33/40
📢 Rating
Merck & Co., Inc. offers a compelling dividend proposition with strong historical performance, a reliable yield, and robust financials. It is recommended for investors prioritizing income stability and moderate growth potential. Prospective investors should consider Merck's steady dividend track record and sound financial health when evaluating their portfolios.
Smart Data Insight
Master the Perfect Entry & Exit for this Stock
Don't leave your profits to chance. Historically, this stock follows specific seasonal patterns that institutional traders use to maximize returns.
- ✅ Identify the "Golden Buying Window"
- ✅ Avoid high-risk correction cycles
- ✅ Backtested data from the last 20+ years