May 29, 2025 a 11:31 am

MPWR: Dividend Analysis - Monolithic Power Systems, Inc.
Monolithic Power Systems, Inc. showcases a robust commitment to shareholder returns with its established dividend policy. The company's dividend yield, combined with consistent growth in dividends over the years, indicates a stable financial foundation. While the yield might appear modest, the safety and growth prospects provide an attractive proposition for dividend-focused investors.
📊 Overview
Monolithic Power Systems, Inc. operates within the technology sector and at present, offers a dividend yield of approximately 0.92%. With a current dividend per share of $4.95 and a 13-year history of dividend payments, the company has demonstrated reliability in its returns to shareholders. Notably, there have been no recent cuts or suspensions in dividends, underscoring its stability.
| Category | Data |
|---|---|
| Sector | Technology |
| Dividend Yield | 0.92% |
| Current Dividend Per Share | $4.95 USD |
| Dividend History | 13 years |
| Last Cut or Suspension | None |
💼 Dividend History
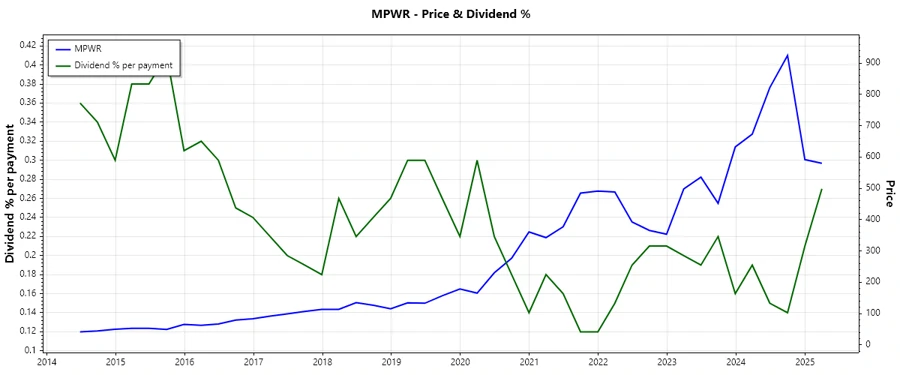
Understanding the past dividends is crucial since a consistent and growing dividend history can indicate the financial health and management focus on shareholder value. Monolithic Power has maintained reliable dividend payouts over the years, showing resilience and growth even under varying economic conditions.
| Year | Dividend Per Share |
|---|---|
| 2025 | $1.56 |
| 2024 | $5.00 |
| 2023 | $4.00 |
| 2022 | $3.00 |
| 2021 | $2.40 |
📈 Dividend Growth
Dividend growth is a critical indicator of a company's capacity to enhance shareholder returns. Over three years, dividends have grown by 27.72%, whereas over five years, the growth is slightly lower at 25.59%, which is a testament to its ability to generate and distribute higher returns to shareholders over time.
| Time | Growth |
|---|---|
| 3 years | 27.72% |
| 5 years | 25.59% |
The average dividend growth is 25.59% over 5 years. This shows moderate but steady dividend growth.
⚠️ Payout Ratio
The payout ratio reveals whether a company is able to sustain its dividend payments through its earnings or cash flow. Currently, its EPS-based payout ratio stands at 12.96%, and the free cash flow-based ratio is 37.85%, indicating a conservative approach to dividends which augurs well for sustainability.
| Key figure | Ratio |
|---|---|
| EPS-based | 12.96% |
| Free cash flow-based | 37.85% |
With an EPS payout ratio of 12.96% and an FCF payout ratio of 37.85%, Monolithic Power operates prudently with ample margin to maintain payments.
✅ Cashflow & Capital Efficiency
Evaluating cash flow and capital efficiency is vital to understand how well a company is generating cash relative to its expenses and needs. Monolithic Power shows strength in its cash flow yields and capital expenditure management, ensuring robust capital efficiency and utilization.
| Metric | 2024 | 2023 | 2022 |
|---|---|---|---|
| Free Cash Flow Yield | 2.23% | 1.93% | 1.14% |
| Earnings Yield | 6.21% | 1.42% | 2.65% |
| CAPEX to Operating Cash Flow | 18.53% | 9.02% | 23.85% |
| Stock-based Compensation to Revenue | 9.32% | 8.22% | 8.97% |
| Free Cash Flow / Operating Cash Flow Ratio | 81.47% | 90.98% | 76.14% |
Cash flows indicate stability with good capital utilization, and strong return on invested capital denotes efficiency in deploying resources.
📉 Balance Sheet & Leverage Analysis
Financial stability, liquidity, and the debt structure of a company are crucial for assessing its long-term viability and risk. Monolithic Power exhibits a healthy balance sheet with low debt levels relative to its assets and equity, suggesting strong financial stability.
| Metric | 2024 | 2023 | 2022 |
|---|---|---|---|
| Debt-to-Equity | 0.41% | 0.27% | 0.23% |
| Debt-to-Assets | 0.36% | 0.23% | 0.18% |
| Debt-to-Capital | 0.41% | 0.27% | 0.23% |
| Net Debt to EBITDA | -1.18 | -1.00 | -0.51 |
| Current Ratio | 5.31 | 7.74 | 5.36 |
| Quick Ratio | 3.89 | 6.11 | 3.66 |
| Financial Leverage | 1.15 | 1.19 | 1.23 |
Monolithic Power’s leverage and ratios indicate strong financial stability, ensuring liquidity and lower risk of financial distress.
🗣️ Fundamental Strength & Profitability
Analyzing profitability and fundamental performance metrics provides insights into a company’s financial health and operational efficiency. With high returns on equity and assets, as well as solid profit margins, Monolithic Power demonstrates robust profitability.
| Metric | 2024 | 2023 | 2022 |
|---|---|---|---|
| Return on Equity | 56.80% | 20.85% | 26.23% |
| Return on Assets | 49.40% | 17.56% | 21.26% |
| Net Profit Margin | 80.95% | 23.47% | 24.39% |
| EBIT Margin | 24.44% | 26.45% | 29.36% |
| EBITDA Margin | 26.09% | 28.66% | 31.43% |
| Gross Margin | 55.32% | 56.07% | 58.44% |
| Research & Development to Revenue | 14.71% | 14.48% | 13.39% |
The strong returns and profit margins position Monolithic Power as a notably efficient and profitable entity within its industry, ensuring sustained financial strength.
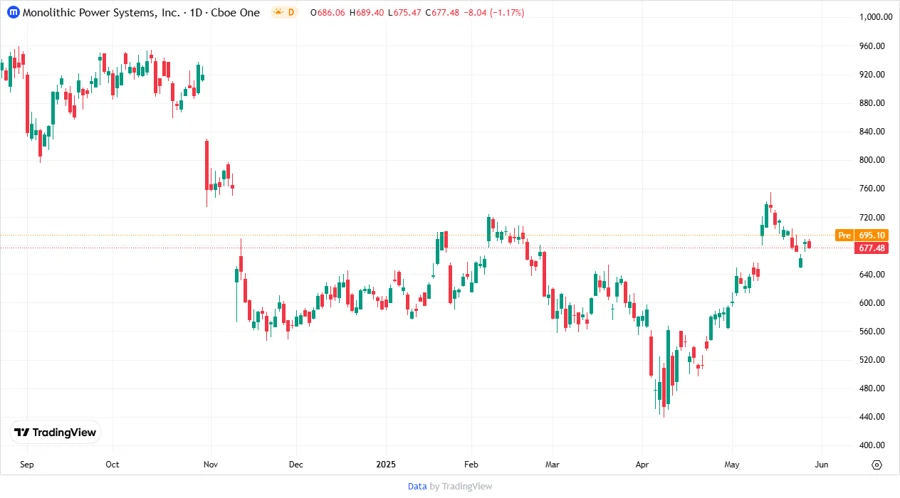
📉 Price Development
🎯 Dividend Scoring System
| Criteria | Score | Score Bar |
|---|---|---|
| Dividend Yield | 3 | |
| Dividend Stability | 5 | |
| Dividend Growth | 4 | |
| Payout Ratio | 5 | |
| Financial Stability | 5 | |
| Dividend Continuity | 5 | |
| Cashflow Coverage | 4 | |
| Balance Sheet Quality | 5 |
Total Score: 36/40
📈 Rating
Monolithic Power Systems, Inc. presents itself as a solid investment option with an impressive balance of stability, growth potential, and prudent financial management. The company garners high scores for its dividend stability, payout ratios, and financial health, making it a noteworthy choice for income-focused investors seeking long-term value with moderate growth potential.
Smart Data Insight
Master the Perfect Entry & Exit for this Stock
Don't leave your profits to chance. Historically, this stock follows specific seasonal patterns that institutional traders use to maximize returns.
- ✅ Identify the "Golden Buying Window"
- ✅ Avoid high-risk correction cycles
- ✅ Backtested data from the last 20+ years