March 09, 2026 a 08:15 am
MPC: Trend and Support & Resistance Analysis - Marathon Petroleum Corporation
Marathon Petroleum Corporation (MPC) has shown strong historical performance within the integrated downstream energy sector, particularly due to its diversified operations across refining, marketing, and midstream segments. Analyzing the technical data reveals a robust upward trend, indicating positive investor sentiment and potential sustained growth. However, investors should remain cautious of volatility reflected in the stock's price movements. The presence of defined support and resistance zones can guide strategic entry and exit points for traders.
Trend Analysis
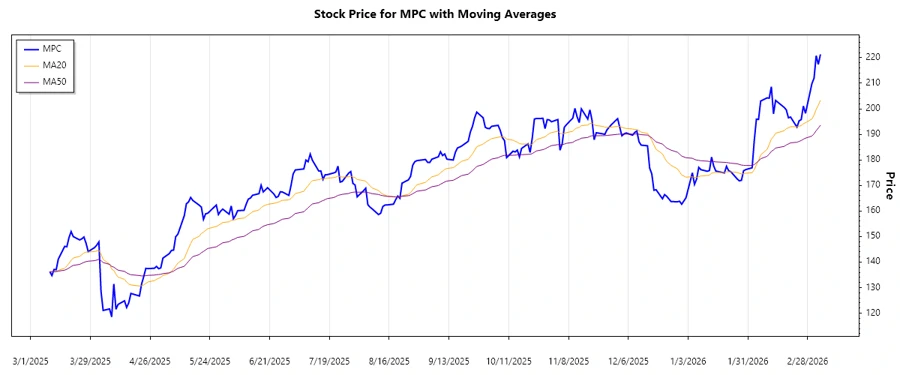
The examination of the recent data shows a notable upward trend in the stock prices of MPC. Calculating the Exponential Moving Averages, EMA20 and EMA50, helps in understanding the strength of this trend.
| Date | Closing Price (USD) | Trend |
|---|---|---|
| 2026-03-06 | 221.28 | ▲ (Upward) |
| 2026-03-05 | 217.36 | ▲ (Upward) |
| 2026-03-04 | 220.77 | ▲ (Upward) |
| 2026-03-03 | 211.98 | ↗ (Upward) |
| 2026-03-02 | 209.82 | ↗ (Upward) |
| 2026-02-27 | 198.21 | ▲ (Upward) |
| 2026-02-26 | 201.07 | ▲ (Upward) |
With EMA20 above EMA50, the trend is confirmed as a strong upward movement, reflecting bullish momentum in the market.
Support- and Resistance
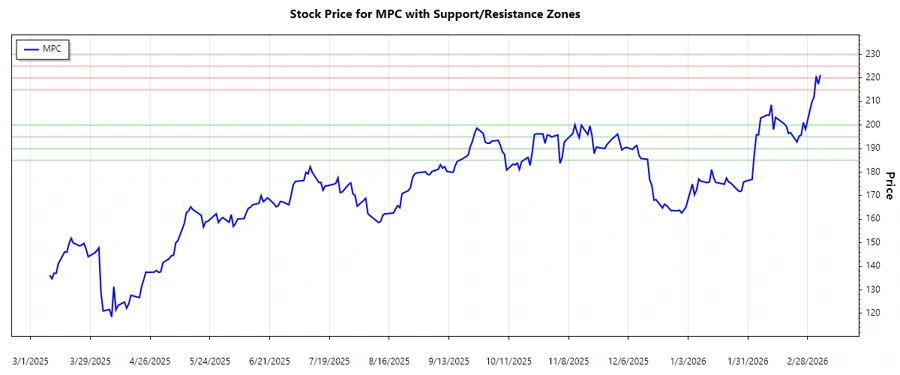
Identifying key support and resistance zones can help investors in strategizing their decisions.
| Zone Type | From (USD) | To (USD) |
|---|---|---|
| Support 1 | 195.00 | 200.00 |
| Support 2 | 185.00 | 190.00 |
| Resistance 1 | 215.00 | 220.00 |
| Resistance 2 | 225.00 | 230.00 |
The current price level is in close proximity to the upper resistance zone, signaling possible consolidation or continuation of the upward trend if it breaks through this level.
Conclusion
Marathon Petroleum Corporation is exhibiting a robust upward trend, driven by increases in closing prices and favorable moving average indicators. The positive momentum suggests potential opportunities for investors looking to capitalize on this trend. However, the proximity to resistance zones requires monitoring as it could indicate consolidation or potential pullbacks. The stock's volatility necessitates vigilance in tracking these technical signals for optimized decision-making.