May 21, 2026 a 06:44 am

MPC: Fibonacci Analysis - Marathon Petroleum Corporation
Marathon Petroleum Corporation (MPC) has recently shown a notable uptrend, reflecting strong business performance with its integrated downstream operations. The company's ability to navigate the volatile energy market alongside robust refining and marketing segments backs the upward trajectory. Investors should monitor the stock as it nears potential resistance levels, gauging its persistence or a possible retracement. With its diverse market presence, MPC remains a compelling option within the energy sector.
Fibonacci Analysis
| Detail | Value | ||||||||||||
|---|---|---|---|---|---|---|---|---|---|---|---|---|---|
| Start Date | 2025-12-15 | ||||||||||||
| End Date | 2026-05-19 | ||||||||||||
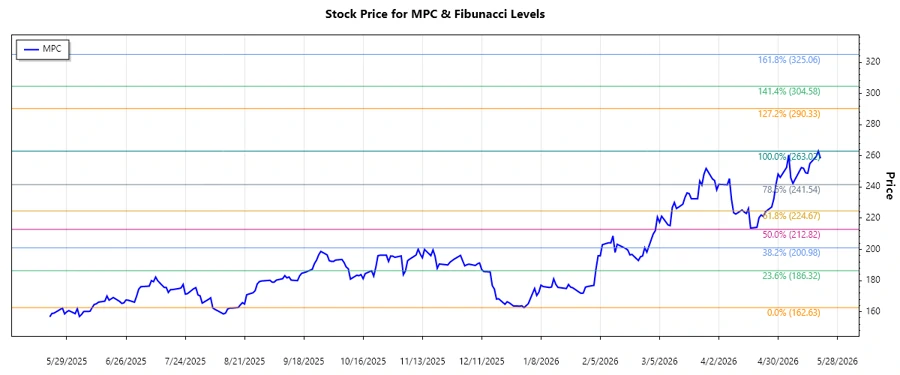
| High Price (Date) | $263.02 (2026-05-19) | ||||||||||||
| Low Price (Date) | $162.63 (2025-12-31) | ||||||||||||
| Fibonacci Levels |
|
||||||||||||
| Current Retracement Zone | None | ||||||||||||
| Interpretation | MPC has broken above typical retracement zones indicating rally strength. Investors should watch if current highs form significant resistance. |
Conclusion
The Marathon Petroleum Corporation showcases impressive upward momentum in its stock price, highlighting a period of strategic leverage within the energy market. This trend indicates strong industry positioning and adept operational execution. However, vigilance is necessary as potential resistance at current highs could challenge continued growth. Retrospective assessments point to the absence of major retracement zones recently, suggesting firm investor confidence or lack of selling pressure. Going forward, the assumption of upper market yields is optimistic if current conditions sustain. Analysts must weigh strengths against possible cyclical downturns in oil and gas prices influencing future valuations.
Smart Data Insight
Master the Perfect Entry & Exit for this Stock
Don't leave your profits to chance. Historically, this stock follows specific seasonal patterns that institutional traders use to maximize returns.
- ✅ Identify the "Golden Buying Window"
- ✅ Avoid high-risk correction cycles
- ✅ Backtested data from the last 20+ years