December 15, 2025 a 03:31 am
MPC: Dividend Analysis - Marathon Petroleum Corporation
Marathon Petroleum Corporation, a leader in the energy sector, offers investors a stable dividend history with a current yield of 1.91%. With a robust market presence, MPC demonstrates consistent financial health which supports ongoing dividend payments. Investors can expect moderate dividend growth aligned with sector trends. Let's dive deeper into the company's dividend profile.
📊 Overview
Marathon Petroleum Corporation is firmly positioned in the energy sector, showcasing a competitive dividend yield with a sustained history over 15 years without recent cuts.
| Sector | Dividend Yield | Current Dividend per Share | Dividend History | Last Cut or Suspension |
|---|---|---|---|---|
| Energy | 1.91% | 3.38 USD | 15 years | None |
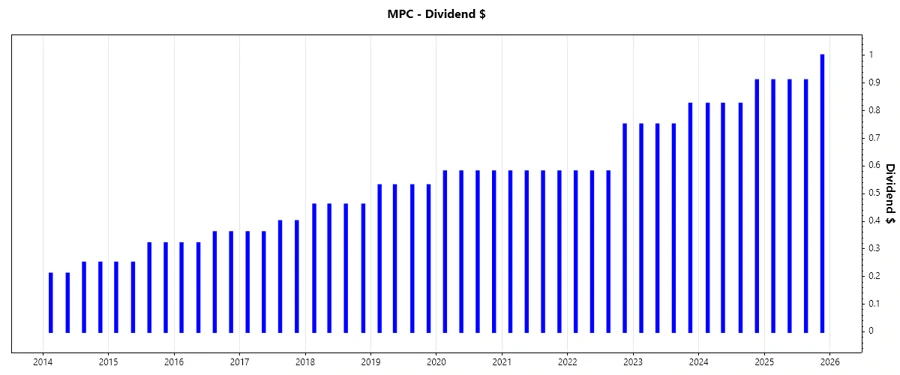
📈 Dividend History
The company's history of dividend payments underscores its commitment to returning value to shareholders. A consistent track record bolsters investor confidence, especially in turbulent market conditions.
| Year | Dividend per Share |
|---|---|
| 2025 | 3.73 USD |
| 2024 | 3.385 USD |
| 2023 | 3.075 USD |
| 2022 | 2.49 USD |
| 2021 | 2.32 USD |
📈 Dividend Growth
Dividend growth is a critical indicator of a company's financial performance and shareholder return strategy. MPC's growth rates reflect its ability to enhance shareholder returns through strategic capital allocation.
| Time Frame | Growth |
|---|---|
| 3 years | 13.42% |
| 5 years | 9.81% |
The average dividend growth is 9.81% over 5 years. This shows moderate but steady dividend growth.
💡 Payout Ratio
A company’s payout ratio impacts its capacity for sustainable dividend payments. Understanding these ratios can inform investment decisions concerning income reliability and growth capacity.
| Key Figure | Ratio |
|---|---|
| EPS-based | 67.79% |
| Free cash flow-based | 23.79% |
The EPS payout ratio of 67.79% means a balanced use of earnings for dividends. A 23.79% FCF payout suggests strong cash flow support for dividends.
🏦 Cashflow & Capital Efficiency
Cash flow metrics reveal how effectively MPC generates cash from operations. Significant Free Cash Flow indicates a capacity for maintaining dividends, investing in growth, and reducing debt.
| Year | Free Cash Flow Yield | Earnings Yield | CAPEX to Operating Cash Flow | Stock-based Compensation to Revenue | Free Cash Flow / Operating Cash Flow Ratio |
|---|---|---|---|---|---|
| 2024 | 12.89% | 7.24% | 29.23% | 0% | 70.77% |
| 2023 | 20.25% | 16.03% | 13.39% | 0% | 86.61% |
| 2022 | 23.39% | 24.35% | 14.79% | 0% | 85.21% |
MPC's robust cash flow generation supports its dividend payments and capital reinvestments, with high efficiency and low reliance on debt-funded operations.
📉 Balance Sheet & Leverage Analysis
Analyzing MPC’s leverage ratios provides insights into its financial solvency and equilibrium. A strong balance sheet is crucial in sustaining dividend capabilities.
| Year | Debt-to-Equity | Debt-to-Assets | Debt-to-Capital | Net Debt to EBITDA | Current Ratio | Quick Ratio | Financial Leverage |
|---|---|---|---|---|---|---|---|
| 2024 | 1.62 | 36.47% | 61.84% | 2.41 | 1.17 | 0.71 | 4.44 |
| 2023 | 1.17 | 33.15% | 53.87% | 1.24 | 1.59 | 1.13 | 3.52 |
| 2022 | 1.01 | 31.04% | 50.17% | 0.78 | 1.76 | 1.32 | 3.24 |
MPC’s improved debt metrics and liquidity ratios provide a solid basis for meeting its financial obligations and sustaining dividend policies.
💪 Fundamental Strength & Profitability
Profitability measures are critical for assessing the company's intrinsic value and potential growth. High profitability often translates to better shareholder returns.
| Year | Return on Equity | Return on Assets | Net Margin | EBIT Margin | EBITDA Margin | Gross Margin |
|---|---|---|---|---|---|---|
| 2024 | 19.41% | 4.37% | 2.48% | 5.23% | 7.63% | 6.69% |
| 2023 | 39.67% | 11.26% | 6.52% | 10.28% | 12.51% | 11.12% |
| 2022 | 52.38% | 16.15% | 8.18% | 12.21% | 14.02% | 12.72% |
With competitive ROE and ROA figures, MPC has demonstrated efficient capital utilization. Strong margins indicate effective operational management.
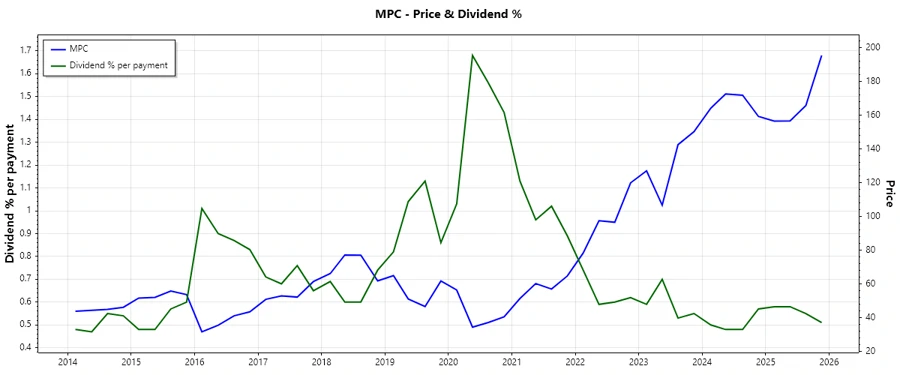
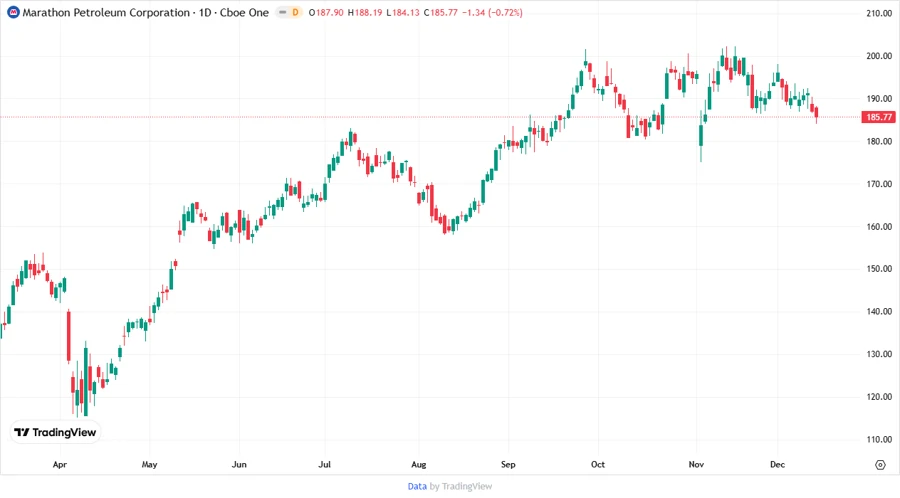
📊 Price Development
✅ Dividend Scoring System
| Criteria | Score | Score Bar |
|---|---|---|
| Dividend yield | 4 | |
| Dividend Stability | 5 | |
| Dividend growth | 3 | |
| Payout ratio | 4 | |
| Financial stability | 4 | |
| Dividend continuity | 5 | |
| Cashflow Coverage | 4 | |
| Balance Sheet Quality | 4 |
Overall Score: 33/40
🗣️ Rating
Marathon Petroleum Corporation receives a strong buy recommendation. The company’s balanced dividend growth, financial stability, and robust profitability make it an attractive option for income-focused investors. Its consistent dividend policy and substantial cash flows highlight MPC’s commitment to shareholder return.