April 06, 2026 a 02:03 pm
MO: Trend and Support & Resistance Analysis - Altria Group, Inc.
The stock of Altria Group, Inc. (MO) has shown mixed performance over the analyzed period, reflecting the intrinsic challenges and opportunities within the tobacco industry. With diverse product offerings that include smokeable, oral, and nicotine pouch products, the company continues to navigate regulatory and market dynamics. Despite market fluctuations, MO's ability to maintain strong brand presence with Marlboro highlights its resilience. Investors should remain attentive to emerging trends in nicotine products as potential growth drivers. Recent technical data reveals crucial insights into the current market sentiment and price action.
Trend Analysis
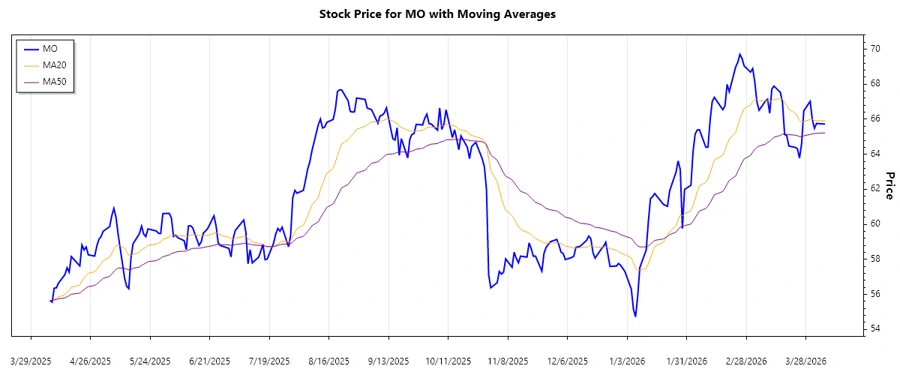
In this period of analysis, Altria exhibited fluctuating trends in its price movements. To identify the most recent trend, we calculated the Exponential Moving Averages (EMAs) of 20 and 50 periods. Currently, the EMA20 stands slightly below the EMA50, suggesting a ▼ bearish continuation at this juncture. Here's a snapshot of the recent trend activity:
| Date | Close Price | Trend Indicator |
|---|---|---|
| 2026-04-06 | 65.72 | ⬇️ |
| 2026-04-02 | 65.76 | ⬇️ |
| 2026-04-01 | 65.48 | ⬇️ |
| 2026-03-31 | 65.99 | ⬇️ |
| 2026-03-30 | 67.02 | ⬆️ |
| 2026-03-27 | 66.48 | ⬆️ |
| 2026-03-26 | 64.62 | ⬇️ |
The movement trends suggest a bearish market sentiment with occasional upward corrections, indicating market uncertainty. The decreasing trend in EMA values aligns with the existing downward price pressure experienced in recent trading sessions.
Support- and Resistance
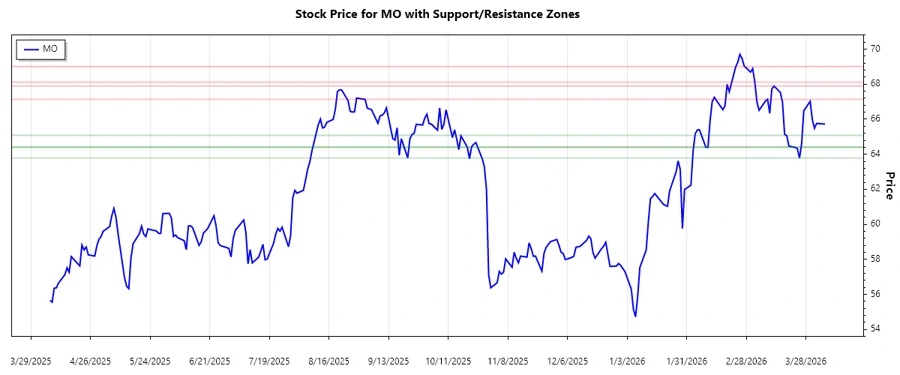
Our detailed examination of historical prices revealed key support and resistance zones. Significant support levels were identified at approximately 63.78 and 64.40, while resistance was noted around 67.13 and 68.12.
| Zone Type | Level Range |
|---|---|
| Support Zone 1 | 63.78 - 64.40 🔼 |
| Support Zone 2 | 64.40 - 65.08 🔼 |
| Resistance Zone 1 | 67.13 - 67.89 🔽 |
| Resistance Zone 2 | 68.12 - 69.01 🔽 |
With the current trading price tipping around these benchmarks, it's essential to watch its behavior near 65.72, considering it hovers near the upper boundary of the identified support zones, indicating potential short-term stability or imminent resistance challenge.
Conclusion
Ultimately, Altria Group’s stock is navigating critical thresholds. The persistent downward trend, as indicated by EMAs, coupled with resistance at higher price levels suggests sell-pressures are considerable. However, robust support zones offer mitigative factors, potentially safeguarding against acute price drops. As the tobacco industry adapts to regulatory changes and emergent consumer trends, technical insights highlight important inflection points, providing investors opportunities to optimize entry or exit points. Long-term prospects hinge on strategic pivots towards less hazardous products.