February 26, 2026 a 10:15 am
MO: Fibonacci Analysis - Altria Group, Inc.
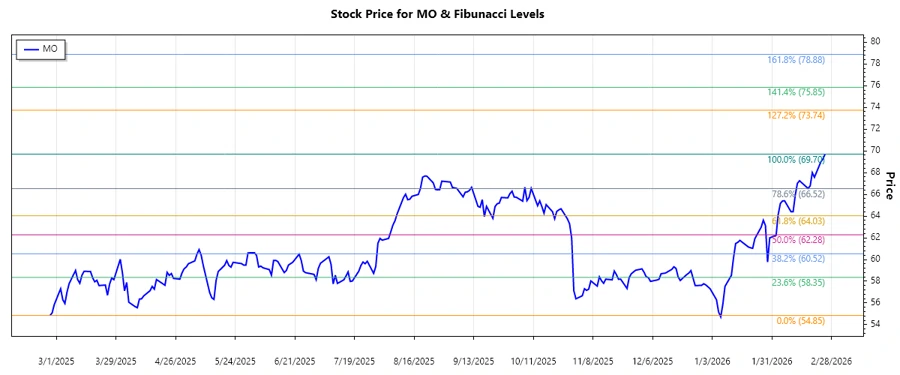
Altria Group, Inc. (MO) has been experiencing notable fluctuations in its stock price. The company, renowned for its tobacco brands, faces the complexities of a shifting consumer base and regulatory landscape. Over the observed period, MO has demonstrated resilience with a clear upward trend that could imply investor confidence in its market strategies.
Fibonacci Analysis
| Detail | Value |
|---|---|
| Start Date | 2025-12-01 |
| End Date | 2026-02-25 |
| High Point (Price and Date) | $69.7 on 2026-02-25 |
| Low Point (Price and Date) | $54.85 on 2025-02-26 |
| Fibonacci Level | Price Level |
|---|---|
| 0.236 | $64.64 |
| 0.382 | $62.98 |
| 0.5 | $61.77 |
| 0.618 | $60.56 |
| 0.786 | $58.83 |
The current price is in the 0.236 Fibonacci retracement level. This suggests it is testing critical support around this level for potential continuation or reversal.
If the price holds above this level, it could signal strong support and potential resumption of the upward trend. Failure to maintain this level might indicate a deeper retracement.
Conclusion
Altria Group, Inc. shows a significant upward trend from late 2025 to early 2026, indicating a potential strong phase of market performance. The current retracement test could provide an entry point for investors anticipating continued growth. However, regulatory changes and health adversities in the tobacco industry may pose risks. Analysts should closely monitor price actions around key Fibonacci levels for better risk management.