November 23, 2025 a 03:15 pm

MO: Fibonacci Analysis - Altria Group, Inc.
The Altria Group has shown a dynamic performance over the past months, especially within the tobacco industry. Given the regulatory pressures and shifting consumer preferences to innovative alternatives, the stock has demonstrated resilience. With its strong brand portfolio, the short-term fluctuations might provide strategic entry or exit points for investors looking for value in a robust dividend-paying company.
Fibonacci Analysis
| Metric | Details |
|---|---|
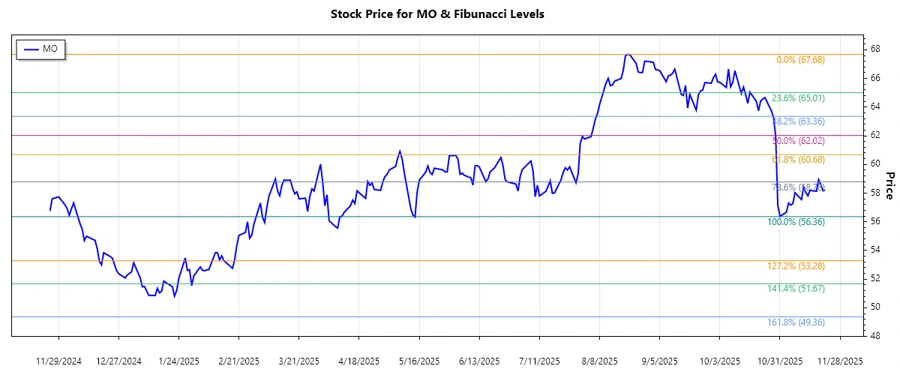
| Trend Type | Down |
| Start Date | 2024-12-09 |
| End Date | 2025-11-21 |
| High Price | $67.68 (2025-08-21) |
| Low Price | $56.36 (2025-04-09) |
| 0.236 Level | $59.11 |
| 0.382 Level | $60.49 |
| 0.5 Level | $61.84 |
| 0.618 Level | $63.20 |
| 0.786 Level | $65.12 |
As of now, the current price is $58.19, which places it within the 0.236 Fibonacci retracement level. This suggests a potential support level where bullish pressure could establish in the near term.
The technical implication could be a phase of accumulation, where investors might consider it a buying opportunity anticipating a potential reversal or a continuation of the primary trend.
Conclusion
The Altria Group stock is currently navigating a bearish channel, as evident from the extended downtrend. However, the presence at the 0.236 Fibonacci level may indicate a potential support point. This juncture provides both a risk and an opportunity for investors. While downside risks remain due to regulatory changes and consumer shift away from traditional tobacco products, the company’s adaptive strategies and solid dividend yield can be appealing to long-term investors. Analysts should remain vigilant for confirmation signals of a trend reversal or continuation to ensure well-informed decision-making.
Smart Data Insight
Master the Perfect Entry & Exit for this Stock
Don't leave your profits to chance. Historically, this stock follows specific seasonal patterns that institutional traders use to maximize returns.
- ✅ Identify the "Golden Buying Window"
- ✅ Avoid high-risk correction cycles
- ✅ Backtested data from the last 20+ years