August 10, 2025 a 06:44 am

MO: Fibonacci Analysis - Altria Group, Inc.
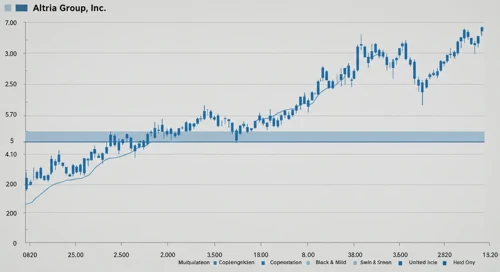
The stock of Altria Group, Inc. has exhibited a recent upward trend, reflecting investor confidence in the company's stable business operations despite regulatory challenges in the tobacco industry. The capability to adapt with innovative products like nicotine pouches is reflected in the current stock performance. With the strengthening trend, it suggests a potentially favorable outlook for long-term investors.
Fibonacci Analysis
| Detail | Information |
|---|---|
| Start Date | 2025-02-18 |
| End Date | 2025-08-08 |
| High Price | 64.19 (2025-08-08) |
| Low Price | 52.75 (2025-02-18) |
| 0.236 Level | 55.75 |
| 0.382 Level | 57.80 |
| 0.5 Level | 58.47 |
| 0.618 Level | 59.14 |
| 0.786 Level | 60.02 |
| Current Retracement Zone | None (Current Price: Not in retracement) |
| Technical Interpretation | The stock is currently above the 0.786 Fibonacci level, indicating strong upward momentum. The recent high suggests potential resistance breaking, with support potentially forming around the 0.618 level. |
Conclusion
The Altria Group, Inc. stock has demonstrated resilient growth in its recent trading history, showing an uptrend beginning February and continuing through August. Fibonacci retracement analysis indicates that key support levels are well below the current price, underscoring bullish sentiment. However, any corrections towards the 0.618 Fibonacci level could present strategic entry points for potential investors. Conversely, investors should remain vigilant for any significant reversals that could signal broader market shifts.
Smart Data Insight
Master the Perfect Entry & Exit for this Stock
Don't leave your profits to chance. Historically, this stock follows specific seasonal patterns that institutional traders use to maximize returns.
- ✅ Identify the "Golden Buying Window"
- ✅ Avoid high-risk correction cycles
- ✅ Backtested data from the last 20+ years