
June 23, 2026 a 12:46 pm
MO: Dividend Analysis - Altria Group, Inc.
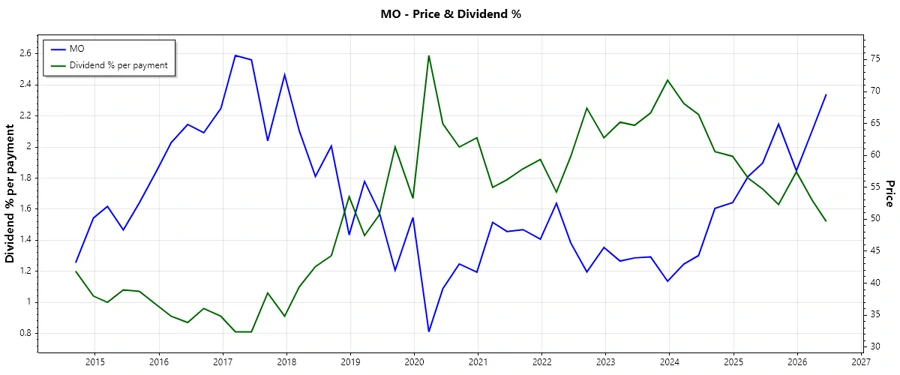
📊 Altria Group, Inc., a renowned player in the tobacco industry, is recognized for its robust dividend policy. With a substantial market cap of approximately $116 billion, Altria maintains an impressive dividend history, indicative of its commitment to returning capital to shareholders. The company's current dividend yield stands at a notable 6.09%, reflecting its potential appeal for income-focused investors.
Overview
🗣️ A detailed examination of Altria's key dividend metrics reveals its remarkable consistency in maintaining shareholder value through dividends. The firm has sustained dividends for 57 consecutive years, underscoring a strong tradition of shareholder returns. Here is an in-depth look at the current dividend indicators:
| Indicator | Value |
|---|---|
| Sector | Tobacco |
| Dividend Yield | 6.09% |
| Current Dividend Per Share | 4.15 USD |
| Dividend History | 57 years |
| Last Cut or Suspension | None |
Dividend History
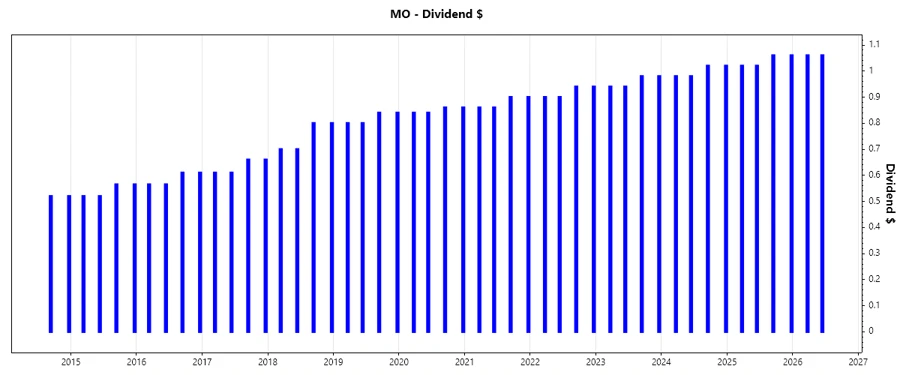
📈 Analyzing the dividend history is crucial for evaluating a company's long-term commitment to shareholder returns. Altria's history offers critical insights into its dividend reliability.
| Year | Dividend Per Share (USD) |
|---|---|
| 2026 | 2.12 |
| 2025 | 4.16 |
| 2024 | 4.00 |
| 2023 | 3.84 |
| 2022 | 3.68 |
Dividend Growth
📉 Altria's dividend growth is an essential parameter reflecting the company's ability to enhance shareholder value. Both the three-year and five-year growth rates demonstrate moderate but steady growth.
| Time | Growth (%) |
|---|---|
| 3 years | 4.17% |
| 5 years | 4.12% |
✅ The average dividend growth is 4.12% over 5 years. This shows moderate but steady dividend growth.
Payout Ratio
🗣️ Altria's payout ratios are a testament to its commitment to distributing a substantial portion of its earnings back to shareholders. Assessing both EPS-based and Free Cash Flow-based payout ratios provides insight into the sustainability of its dividends.
| Key Figure | Ratio (%) |
|---|---|
| EPS-based | 86.22% |
| Free Cash Flow-based | 80.37% |
⚠️ With an EPS payout ratio of 86.22% and a free cash flow payout ratio of 80.37%, Altria exhibits a high commitment to dividends, although it implies a significant reliance on maintaining earnings to cover these distributions.
Cashflow & Capital Efficiency
💼 Analyzing Altria's cash flow and capital efficiency is crucial for a holistic view of its financial health. Metrics such as Free Cash Flow Yield and Earnings Yield provide stakeholders with insights into the company’s capacity to generate cash relative to its financing.
| Year | 2023 | 2024 | 2025 |
|---|---|---|---|
| Free Cash Flow Yield | 7.43% | 9.58% | 9.38% |
| Earnings Yield | 6.92% | 12.54% | 7.18% |
| CAPEX to Operating Cash Flow | 3.05% | 1.62% | 2.33% |
| Stock-based Compensation to Revenue | 0.00% | 1.02% | 0.00% |
| Free Cash Flow / Operating Cash Flow Ratio | 97.67% | 98.38% | 97.67% |
⚠️ The assessment indicates strong Free Cash Flow Yield, reaffirming Altria's ability to cover its dividends consistently. However, attention to capital allocation efficiency remains critical.
Balance Sheet & Leverage Analysis
📈 A comprehensive balance sheet evaluation helps determine a firm's ability to manage liabilities and leverage its assets effectively. This is paramount for understanding financial stability and ability to weather economic fluctuations.
| Year | 2023 | 2024 | 2025 |
|---|---|---|---|
| Debt-to-Equity | -741% | -1113% | -734% |
| Debt-to-Assets | 68% | 70.86% | 73.42% |
| Debt-to-Capital | 115.59% | 109.86% | 115.77% |
| Net Debt to EBITDA | 1.83 | 1.45 | 1.96 |
| Current Ratio | 0.49 | 0.51 | 0.61 |
| Quick Ratio | 0.39 | 0.39 | 0.49 |
| Financial Leverage | -741% | -1571% | -999% |
⚠️ The analysis highlights high leverage ratios, potentially risky in times of downturn. However, Altria’s ability to cover interests implies a balanced approach to financial stability.
Fundamental Strength & Profitability
📊 Understanding Altria’s fundamentals and profitability metrics is vital for evaluating operational success and efficiency.
| Year | 2023 | 2024 | 2025 |
|---|---|---|---|
| Return on Equity | -2.30% | -5.03% | -1.98% |
| Return on Assets | 0.21% | 0.32% | 0.20% |
| Return on Invested Capital | 30.28% | 33.20% | 42.95% |
| Margins: Net | 39.65% | 55.10% | 34.50% |
| Margins: EBIT | 58.91% | 72.30% | 52.47% |
| Margins: EBITDA | 60.23% | 73.70% | 53.79% |
| Margins: Gross | 69.67% | 70.27% | 86.59% |
| R&D to Revenue | 0.00% | 1.02% | 0.97% |
⚠️ The negative Return on Equity requires attention; however, substantial margins in other metrics suggest operational efficiency and profitability.
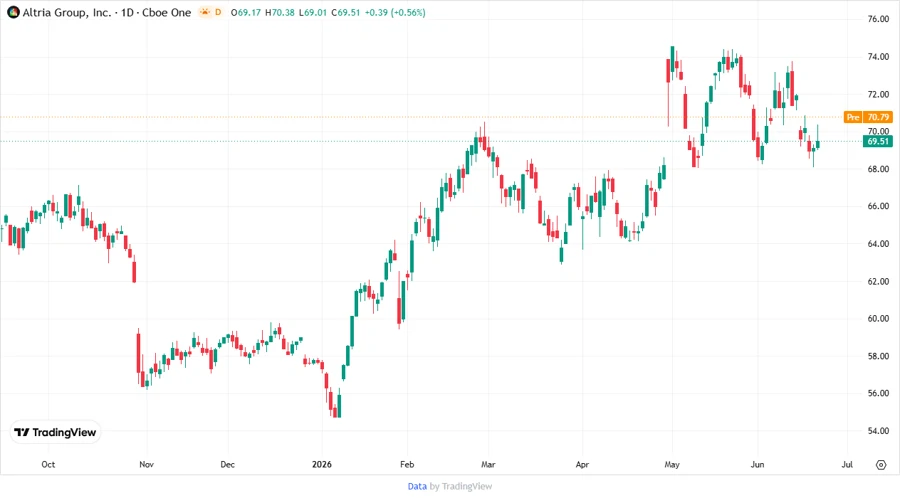
Price Development
Dividend Scoring System
| Criteria | Score (1-5) | Score Bar |
|---|---|---|
| Dividend yield | 4 | |
| Dividend Stability | 5 | |
| Dividend growth | 3 | |
| Payout ratio | 3 | |
| Financial stability | 3 | |
| Dividend continuity | 5 | |
| Cashflow Coverage | 4 | |
| Balance Sheet Quality | 2 |
Total Score: 29/40
Rating
✅ In conclusion, Altria Group, Inc. demonstrates a strong dividend profile with consistent payouts and reasonable growth potential. While certain financial metrics indicate the need for cautious optimism, Altria's historical dividend practices and yield make it a compelling option for dividend-focused investors. Continued monitoring of its financial health and operational performance remains crucial for long-term investment decisions.
Smart Data Insight
Master the Perfect Entry & Exit for this Stock
Don't leave your profits to chance. Historically, this stock follows specific seasonal patterns that institutional traders use to maximize returns.
- ✅ Identify the "Golden Buying Window"
- ✅ Avoid high-risk correction cycles
- ✅ Backtested data from the last 20+ years