January 10, 2026 a 02:46 am

MO: Dividend Analysis - Altria Group, Inc.
Altria Group, Inc., a leader in the Tobacco sector, demonstrates a compelling dividend profile with a noteworthy yield of 7.22%. The company commands a robust history of 56 consecutive years of dividend payments, underscoring its commitment to shareholder returns. However, the last cut in 2009 may raise caution for the risk-averse investor. With dividend growth at a modest pace over 3 and 5 years, Altria continues to offer stable, albeit conservative, dividend increments. These factors are complemented by a high payout ratio, reflecting a focus on dividends rather than growth or reinvestment.
📊 Overview
| Metric | Value |
|---|---|
| Sector | Tobacco |
| Dividend Yield | 7.22 % |
| Current Dividend per Share | 3.98 USD |
| Dividend History | 56 years |
| Last Cut or Suspension | 2009 |
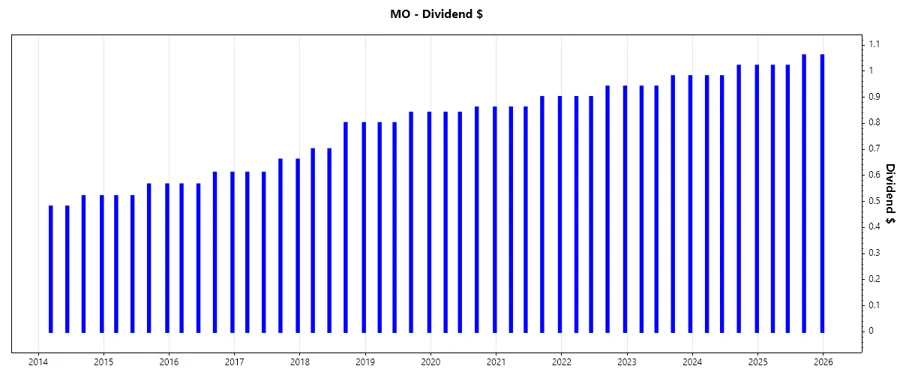
📉 Dividend History
Altria's established history of dividend payments for over five decades marks its strength in providing reliable returns. This consistency is vital for income-focused investors seeking stability. Regular increases in its annual dividends reflect a commitment to rewarding shareholders despite challenging market conditions.
| Year | Dividend per Share (USD) |
|---|---|
| 2025 | 4.16 |
| 2024 | 4.00 |
| 2023 | 3.84 |
| 2022 | 3.68 |
| 2021 | 3.52 |
📈 Dividend Growth
Dividend growth is a critical metric for evaluating income sustainability. Altria's 3-year and 5-year dividend growth rates are steady but modest, reflecting consistency rather than aggressive enhancement.
| Time | Growth |
|---|---|
| 3 years | 4.17 % |
| 5 years | 4.12 % |
The average dividend growth is 4.12 % over 5 years. This shows moderate but steady dividend growth.
✅ Payout Ratio
A high payout ratio indicates Altria's prioritization of dividends over reinvestment into company growth.
| Key Figure | Ratio |
|---|---|
| EPS-based | 75.65 % |
| Free Cash Flow-based | 57.81 % |
The 75.65% EPS payout indicates significant earnings distribution to dividends, balanced by an FCF payout of 57.81%, suggesting strong cash flow coverage for dividends.
🗣️ Cashflow & Capital Efficiency
Cashflow metrics are integral for evaluating the company's operational health and reinvestment capacity. The free cash flow yield and CAPEX ratios provide insight into financial prudence and operational liquidity.
| Year | 2024 | 2023 | 2022 |
|---|---|---|---|
| Free Cash Flow Yield | 9.59 % | 12.78 % | 9.76 % |
| Earnings Yield | 12.54 % | 11.43 % | 6.99 % |
| CAPEX to Operating Cash Flow | 1.54 % | 2.11 % | 2.48 % |
| Stock-based Compensation to Revenue | 0 % | 0.28 % | 0.24 % |
| Free Cash Flow / Operating Cash Flow Ratio | 98.38 % | 97.89 % | 97.52 % |
The stable cash flow ratio supports dividend sustainability and indicates efficient capital use, though improvements in capital efficiency would strengthen financial robustness.
🔍 Balance Sheet & Leverage Analysis
Assessing the balance sheet and leverage metrics provides insight into financial risk and liquidity, with leverage ratios indicating debt management efficacy.
| Year | 2024 | 2023 | 2022 |
|---|---|---|---|
| Debt-to-Equity | -11.14 | -7.41 | -6.71 |
| Debt-to-Assets | 70.86 % | 68.01 % | 72.20 % |
| Debt-to-Capital | 1.10 | 1.16 | 1.17 |
| Net Debt to EBITDA | 1.45 | 1.83 | 2.59 |
| Current Ratio | 0.51 | 0.49 | 0.84 |
| Quick Ratio | 0.39 | 0.39 | 0.70 |
| Financial Leverage | -15.72 | -10.90 | -9.30 |
High leverage and negative ROE present potential risks, despite reasonable interest coverage, posing concerns for financial stability and liquidity.
📏 Fundamental Strength & Profitability
These metrics exhibit operational efficiency and profitability, essential for gauging the company's overall health and potential for future growth.
| Year | 2024 | 2023 | 2022 |
|---|---|---|---|
| Return on Equity | -5.03 % | -2.30 % | -1.45 % |
| Return on Assets | 0.32 % | 0.21 % | 0.16 % |
| Return on Invested Capital | 0.33 % | 0.30 % | 0.31 % |
| Net Margin | 55.10 % | 39.65 % | 27.86 % |
| EBIT Margin | 72.30 % | 58.91 % | 41.17 % |
| EBITDA Margin | 73.70 % | 60.23 % | 42.26 % |
| Gross Margin | 70.27 % | 69.67 % | 68.86 % |
| Research & Development to Revenue | 1.02 % | 0.00 % | 0.00 % |
The negative ROE and modest ROIC highlight underperformance, yet robust margin figures in recent years depict operational efficiency.
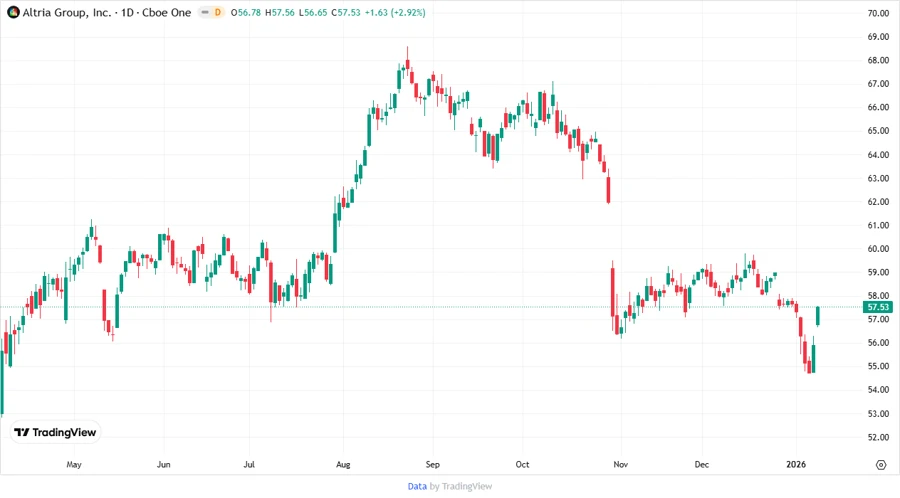
📈 Price Development
🗳️ Dividend Scoring System
| Category | Score | |
|---|---|---|
| Dividend Yield | 4 | |
| Dividend Stability | 5 | |
| Dividend Growth | 3 | |
| Payout Ratio | 3 | |
| Financial Stability | 2 | |
| Dividend Continuity | 5 | |
| Cashflow Coverage | 4 | |
| Balance Sheet Quality | 2 |
Total Score: 28/40
🎯 Rating
Altria Group's dividend profile shows strength primarily in its yield and stability, which suits income investors seeking steady payouts. However, its financial stability and growth prospects require caution. The continuous dividend history and solid cashflow coverage make it a viable consideration for moderate risk income portfolios. Final rating: Hold.