December 12, 2025 a 03:31 pm


MO: Dividend Analysis - Altria Group, Inc.
Altria Group, Inc., a major player in the tobacco industry, boasts a robust dividend profile backed by a history of consistent dividend payments for 56 consecutive years. Despite facing challenges in modernizing its business model due to shifting consumer preferences and regulatory conditions, the company manages to maintain its commitment to dividend growth. The financial health and sustainability of dividends remain crucial considerations for investors.
📊 Overview
With a rich history in the tobacco sector, Altria Group continues to offer appealing dividends while balancing high payout ratios. This stability indicates confidence in its cash flow generation, emphasized by effective capital allocation strategies.
| Metric | Value |
|---|---|
| Sector | Tobacco |
| Dividend yield | 0 % |
| Current dividend per share | 3.98 USD |
| Dividend history | 56 years |
| Last cut or suspension | 2009 |
🗣️ Dividend History
Altria Group's dividend history reflects its commitment to shareholder returns with a consistent track record. This consistency is an important indicator of financial resilience. Any historical cuts were prudently managed to safeguard financial standing.
| Year | Dividend per Share (USD) |
|---|---|
| 2025 | 4.16 |
| 2024 | 4.00 |
| 2023 | 3.84 |
| 2022 | 3.68 |
| 2021 | 3.52 |
📈 Dividend Growth
A consistent dividend growth demonstrates management's confidence in ongoing cash flows. It acts as a signal of financial health and stability for investors seeking steady returns.
| Time | Growth |
|---|---|
| 3 years | 4.35 % |
| 5 years | 4.05 % |
The average dividend growth is 4.05 % over 5 years. This shows moderate but steady dividend growth.
⚠️ Payout Ratio
Payout ratios indicate how well earnings support dividends. A high payout ratio may suggest vulnerability should earnings dip, yet Altria's ratio signifies a sustained balance between earnings and dividend commitments.
| Key figure ratio | Value |
|---|---|
| EPS-based | 75.65 % |
| Free cash flow-based | 57.81 % |
The EPS payout ratio of 75.65 % and FCF payout ratio of 57.81 % suggest that the company's dividends are adequately supported by its earnings and cash flow, albeit with little margin for an earnings dip.
📊 Cashflow & Capital Efficiency
Cash flow measures are integral for assessing dividend sustainability. Altria's cash flow yields and capital efficiency ratios can provide insights into operational quality and investment returns.
| Year | 2022 | 2023 | 2024 |
|---|---|---|---|
| Free Cash Flow Yield | 9.76 % | 12.78 % | 9.58 % |
| Earnings Yield | 6.99 % | 11.43 % | 12.54 % |
| CAPEX to Operating Cash Flow | 2.48 % | 2.11 % | 1.62 % |
| Stock-based Compensation to Revenue | 0.24 % | 0.28 % | 0.0 % |
| Free Cash Flow / Operating Cash Flow Ratio | 97.52 % | 97.89 % | 98.38 % |
These cash flow and efficiency metrics reflect Altria's capacity to manage and deploy capital profitably, ensuring the generation of sufficient free cash flow to maintain dividends.
📊 Balance Sheet & Leverage Analysis
These metrics assess Altria's financial stability, balance sheet strength, and leverage management, which are crucial for evaluating long-term sustainability.
| Year | 2022 | 2023 | 2024 |
|---|---|---|---|
| Debt-to-Equity | -671.53 % | -741.04 % | -1113.76 % |
| Debt-to-Assets | 72.20 % | 68.01 % | 70.86 % |
| Debt-to-Capital | 117.50 % | 115.60 % | 109.86 % |
| Net Debt to EBITDA | 2.59 | 1.83 | 1.45 |
| Current Ratio | 0.84 | 0.49 | 0.51 |
| Quick Ratio | 0.70 | 0.39 | 0.39 |
| Financial Leverage | -930.13 % | -1089.55 % | -1571.81 % |
These figures, although negative in leverage ratios, signify Altria’s aggressive capitalization strategy but also highlight solvent operations with a substantial emphasis on managing cash flows effectively.
📈 Fundamental Strength & Profitability
Profitability metrics are vital in understanding the firm’s ability to generate earnings compared to various input costs, reflecting on its overall performance efficiency.
| Year | 2022 | 2023 | 2024 |
|---|---|---|---|
| Return on Equity | -1.45 % | -2.30 % | -5.03 % |
| Return on Assets | 15.60 % | 21.08 % | 32.02 % |
| Margins: Net | 27.86 % | 39.65 % | 55.10 % |
| EBIT Margin | 41.17 % | 58.91 % | 72.30 % |
| EBITDA Margin | 42.26 % | 60.23 % | 73.70 % |
Whilst the company reports negative return on equity over recent years, efficiencies as evidenced by net and EBITDA margins suggest strong operational profitability.
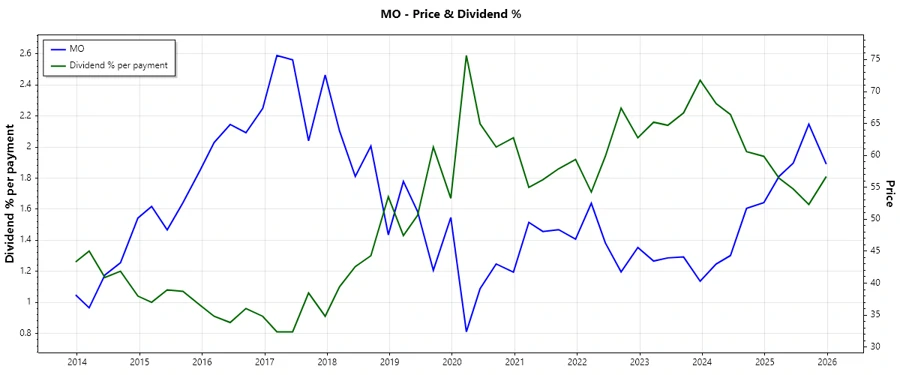
📈 Price Development
✅ Dividend Scoring System
| Category | Score | Score Bar |
|---|---|---|
| Dividend Yield | 4 | |
| Dividend Stability | 5 | |
| Dividend Growth | 3 | |
| Payout Ratio | 3 | |
| Financial Stability | 3 | |
| Dividend Continuity | 5 | |
| Cashflow Coverage | 4 | |
| Balance Sheet Quality | 3 |
Overall Score: 30/40
🗣️ Rating
Altria Group, Inc. maintains a dedicated dividend strategy, appealing to income-focused investors. However, challenges in leverage ratios and ROE necessitate a cautious approach. Keeping a close eye on evolving market dynamics and potential strategic pivots towards new business areas is advisable.