November 15, 2025 a 02:47 am

MO: Dividend Analysis - Altria Group, Inc.
Altria Group, Inc. presents a commendable dividend profile with a robust history of payments. Despite the challenges in earnings growth, the company's sustained high dividend yield makes it attractive for income-focused investors. Nevertheless, the negative returns on equity present caution for long-term growth prospects.
📊 Overview
Altria Group operates within the Consumer Goods sector, showcasing a formidable dividend yield and consistent payment history.
| Details | Values |
|---|---|
| Sector | Consumer Goods |
| Dividend yield | 6.35 % |
| Current dividend per share | 3.98 USD |
| Dividend history | 56 years |
| Last cut or suspension | None |
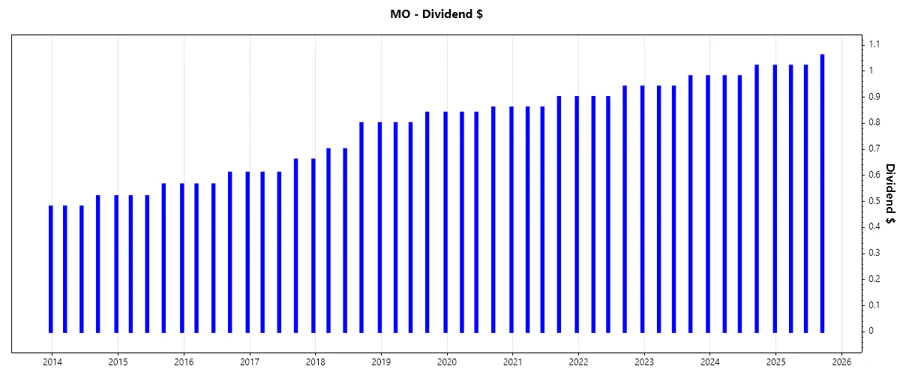
🗣️ Dividend History
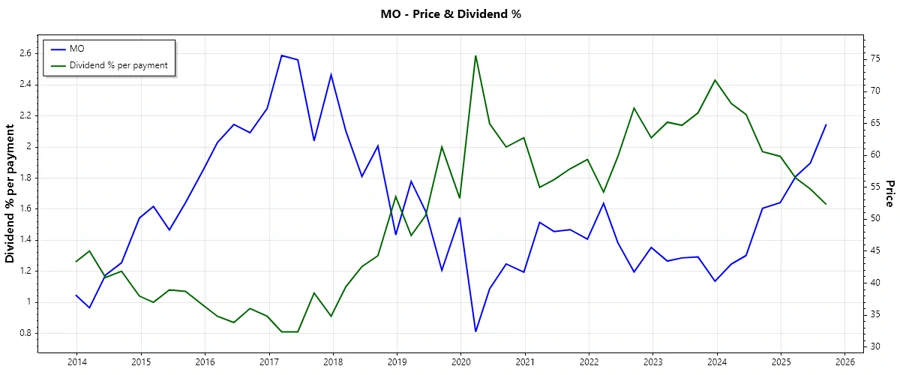
The history of dividends paid by Altria shows resilience. With a consistent increase in dividends over several years, it signifies a strong commitment to shareholders.
| Year | Dividend per Share (USD) |
|---|---|
| 2025 | 3.10 |
| 2024 | 4.00 |
| 2023 | 3.84 |
| 2022 | 3.68 |
| 2021 | 3.52 |
📈 Dividend Growth
Altria exhibits steady dividend growth, reflecting its ability to generate and distribute income. Analyzing the growth rate over different periods provides insight into the sustainability of this trend.
| Time | Growth |
|---|---|
| 3 years | 4.35 % |
| 5 years | 4.05 % |
The average dividend growth is 4.05 % over 5 years. This shows moderate but steady dividend growth.
✅ Payout Ratio
The payout ratios provide critical insights into the sustainability of dividend payments. Altria's payout from EPS is substantial, yet the free cash flow coverage indicates sufficient sustainability.
| Key figure | Ratio |
|---|---|
| EPS-based | 75.65 % |
| Free cash flow-based | 57.81 % |
The payout ratio based on EPS is slightly high at 75.65 %, while the free cash flow-based ratio of 57.81 % remains well within a comfortable range, indicating a sound ability to continue dividend payments without excessive strain on financial resources.
⚠️ Cashflow & Capital Efficiency
Understanding cash flow and capital efficiency ratios helps assess a company's financial health and dividend payment capabilities. Altria's ratios are suggestive of a disciplined approach to maximizing shareholder value.
| Metric | 2024 | 2023 | 2022 |
|---|---|---|---|
| Free Cash Flow Yield | 9.59 % | 12.78 % | 9.76 % |
| Earnings Yield | 12.54 % | 11.43 % | 6.99 % |
| CAPEX to Operating Cash Flow | 1.54 % | 2.11 % | 2.48 % |
| Stock-based Compensation to Revenue | 0 % | 0.28 % | 0.24 % |
| Free Cash Flow / Operating Cash Flow Ratio | 98.38 % | 97.89 % | 97.51 % |
Altria's cash flow ratios indicate strong cash flow generation, with a free cash flow yield that supports its earnings yield, ensuring that dividend payouts are underpinned by solid cash generation. The CAPEX to operating cash flow ratio shows limited expenditure, highlighting capital efficiency.
📉 Balance Sheet & Leverage Analysis
By examining balance sheet metrics, investors can assess financial stability. Altria’s leverage ratios are considerably negative, largely driven by its equity deficits, necessitating careful consideration by prospective investors.
| Metric | 2024 | 2023 | 2022 |
|---|---|---|---|
| Debt-to-Equity | -11.14 | -7.41 | -6.72 |
| Debt-to-Assets | 70.86 % | 68.01 % | 72.20 % |
| Debt-to-Capital | 109.86 % | 115.60 % | 117.50 % |
| Net Debt to EBITDA | 2.12 | 1.83 | 2.59 |
| Current Ratio | 0.51 | 0.49 | 0.84 |
| Quick Ratio | 0.39 | 0.39 | 0.70 |
The analysis of Altria's financial leverage indicates potential challenges in equity structure, with higher debt levels relative to assets and capital. The consistently low current and quick ratios highlight liquidity constraints, warranting careful monitoring.
📈 Fundamental Strength & Profitability
Profitability and operational efficiency ratios underpin growth prospects and operational robustness. Altria's returns and margin metrics reveal vital insights into performance efficiency.
| Metric | 2024 | 2023 | 2022 |
|---|---|---|---|
| Return on Equity | -5.03 % | -2.30 % | -1.45 % |
| Return on Assets | 0.32 % | 0.21 % | 0.16 % |
| Margins: Net | 55.10 % | 39.65 % | 27.86 % |
| Margins: EBIT | 72.30 % | 58.91 % | 41.17 % |
| Margins: EBITDA | 73.70 % | 60.23 % | 42.26 % |
| Margins: Gross | 70.27 % | 69.67 % | 68.86 % |
| R&D to Revenue | 1.02 % | 0 % | 0 % |
Altria’s profitability ratios depict modest operational yields, adversely affected by negative returns on equity. However, solid margins indicate operational efficiency, suggesting underlying strengths.
Price Development
📉 Dividend Scoring System
| Criteria | Score | Score Bar |
|---|---|---|
| Dividend yield | 4 | |
| Dividend Stability | 5 | |
| Dividend growth | 3 | |
| Payout ratio | 4 | |
| Financial stability | 2 | |
| Dividend continuity | 5 | |
| Cashflow Coverage | 4 | |
| Balance Sheet Quality | 2 |
Total Score: 29/40
Rating
Altria Group, Inc. offers an attractive proposition for income-oriented investors, thanks to its resilient dividend yield and history. However, potential investors need to remain cautious of the existing financial and leverage challenges. The market stability of its stock price and conservative dividend approach are notable strengths, with a recommended Hold/Buy rating for those prioritizing income over growth.
Smart Data Insight
Master the Perfect Entry & Exit for this Stock
Don't leave your profits to chance. Historically, this stock follows specific seasonal patterns that institutional traders use to maximize returns.
- ✅ Identify the "Golden Buying Window"
- ✅ Avoid high-risk correction cycles
- ✅ Backtested data from the last 20+ years