May 30, 2025 a 07:47 am


MO: Dividend Analysis - Altria Group, Inc.
The dividend profile of Altria Group, Inc. presents a sophisticated balance between yield and stability. With a substantial market capitalization, its ability to maintain consistent payments over a long history offers confidence to dividend-seeking investors. Challenges remain in balancing growth with payout ratios, yet Altria's veteran status in dividend reliability offers potential benefits for income-centric portfolios.
📊 Overview
Altria Group, Inc. operates in the sector distinguished by its robust dividend yield and consistent history. Its strategic approach ensures shareholder value through dividends, backed by decades of uninterrupted payment.
| Metric | Value |
|---|---|
| Sector | Consumer Staples |
| Dividend yield | 6.86 % |
| Current dividend per share | $3.98 |
| Dividend history | 56 years |
| Last cut or suspension | None |
🗣️ Dividend History
The consistent payment history of Altria Group underscores its reliability. A long streak of dividend payments without suspensions reflects resilience and sustained financial health, critical for investors focusing on long-term income.
| Year | Dividend per Share (USD) |
|---|---|
| 2025 | $2.04 |
| 2024 | $4.00 |
| 2023 | $3.84 |
| 2022 | $3.68 |
| 2021 | $3.52 |
📈 Dividend Growth
Assessing dividend growth offers insights into a company's future payout potential. A steady increase signifies financial robustness and strategic growth alignment, important for assessing long-term investment value.
| Time | Growth |
|---|---|
| 3 years | 4.35 % |
| 5 years | 4.05 % |
The average dividend growth is 4.05 % over 5 years. This shows moderate but steady dividend growth.
✅ Payout Ratio
Payout ratios are crucial for evaluating dividend sustainability. They reveal how much earnings are paid out as dividends, indicating financial health and profit reinvestment levels.
| Key figure ratio | Value |
|---|---|
| EPS-based | 65.94 % |
| Free cash flow-based | 79.41 % |
An EPS payout ratio of 65.94% suggests a balanced allocation, allowing for reinvestment. A higher FCF payout ratio at 79.41% warrants caution, indicating potential cash flow pressure.
Cashflow & Capital Efficiency
Strong cash flows and efficient capital use indicate underlying economic strength. These metrics offer insights into a firm's ability to sustain operations and future dividends.
| Metric | 2024 | 2023 | 2022 |
|---|---|---|---|
| Free Cash Flow Yield | 9.59 % | 12.78 % | 9.76 % |
| Earnings Yield | 12.54 % | 11.43 % | 6.99 % |
| CAPEX to Operating Cash Flow | 1.62 % | 2.11 % | 2.48 % |
| Stock-based Compensation to Revenue | 0 | 0.28 % | 0.24 % |
| Free Cash Flow / Operating Cash Flow Ratio | 98.38 % | 97.89 % | 97.52 % |
Cash flow stability, indicated by high free cash flow yields, supports ongoing dividend obligations and indicates sound capital efficiency. This reflects positively on Altria's financial stewardship.
Balance Sheet & Leverage Analysis
Analyzing leverage and the balance sheet provides insights into financial structural health, crucial for long-term sustainability and risk evaluation.
| Metric | 2024 | 2023 | 2022 |
|---|---|---|---|
| Debt-to-Equity | -1113.76 % | -741.05 % | -671.53 % |
| Debt-to-Assets | 70.86 % | 68.01 % | 72.20 % |
| Debt-to-Capital | 109.86 % | 115.60 % | 117.50 % |
| Net Debt to EBITDA | 1.45 | 1.83 | 1.81 |
| Current Ratio | 0.51 | 0.49 | 0.84 |
| Quick Ratio | 0.39 | 0.39 | 0.70 |
| Financial Leverage | -1571.81 % | -1089.55 % | -930.13 % |
The negative debt-to-equity ratios denote a heavily leveraged position, a strategy that holds implications for financing costs amidst varying economic conditions. The feasibility of sustaining such leverage remains a watchpoint.
Fundamental Strength & Profitability
Key profitability indicators reflect the inherent strength of operations to generate returns, underpinning the ability to distribute earnings as dividends sustainably.
| Metric | 2024 | 2023 | 2022 |
|---|---|---|---|
| Return on Equity | -5.03 % | -2.30 % | -1.45 % |
| Return on Assets | 0.32 % | 0.21 % | 0.16 % |
| Margins: Net | 55.10 % | 39.65 % | 27.86 % |
| Margins: EBIT | 72.31 % | 58.91 % | 41.17 % |
| Margins: EBITDA | 73.70 % | 60.23 % | 60.55 % |
| Margins: Gross | 70.27 % | 69.67 % | 68.86 % |
| Research & Development to Revenue | - | - | 0.78 % |
While significant profit margins suggest effective cost control, the trend of negative returns on equity highlights challenges in generating shareholder returns, which could hinder capital reinvestment capabilities.
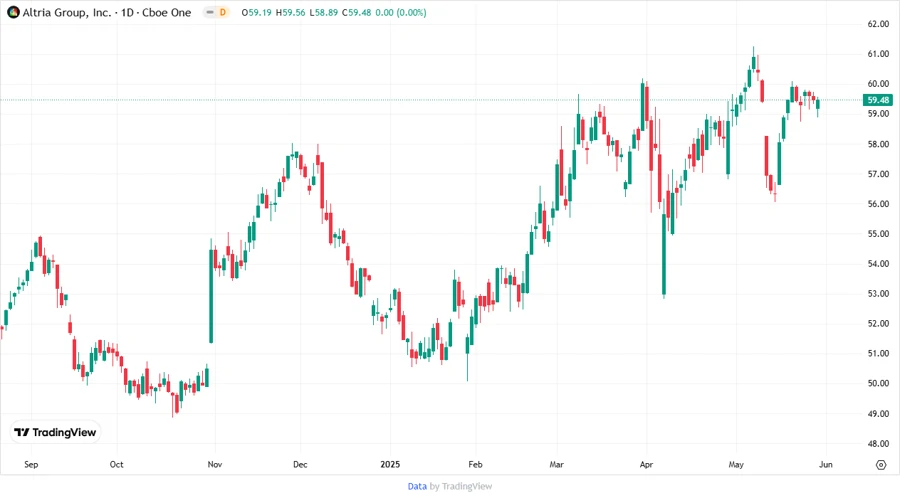
Price Development
🌓 Dividend Scoring System
| Criteria | Score | Score Bar |
|---|---|---|
| Dividend yield | 5 | |
| Dividend Stability | 4 | |
| Dividend growth | 3 | |
| Payout ratio | 3 | |
| Financial stability | 2 | |
| Dividend continuity | 5 | |
| Cashflow Coverage | 4 | |
| Balance Sheet Quality | 2 |
Total Score: 28/40
⚠️ Rating
Altria Group's dividend profile suggests a compelling opportunity for income-oriented investors, driven by a robust yield and consistent historical payments. However, challenges in balance sheet stability and growth ratios necessitate a cautious approach. Overall, it represents a solid dividend player, but investors should remain vigilant about macroeconomic factors and leverage levels.
Smart Data Insight
Master the Perfect Entry & Exit for this Stock
Don't leave your profits to chance. Historically, this stock follows specific seasonal patterns that institutional traders use to maximize returns.
- ✅ Identify the "Golden Buying Window"
- ✅ Avoid high-risk correction cycles
- ✅ Backtested data from the last 20+ years