
July 06, 2026 a 01:15 pm
MOS: Trend and Support & Resistance Analysis - The Mosaic Company
The Mosaic Company's stock has seen significant fluctuations in recent months, reflecting the global challenges and opportunities in the agricultural nutrient sector. Recent analysis indicates a potential reversal pattern forming, suggesting cautious optimism for investors. The company's diverse product offerings and extensive market reach continue to make it a key player in its industry. With key support and resistance levels in focus, understanding the technical trends will be essential for strategic investment decisions.
Trend Analysis
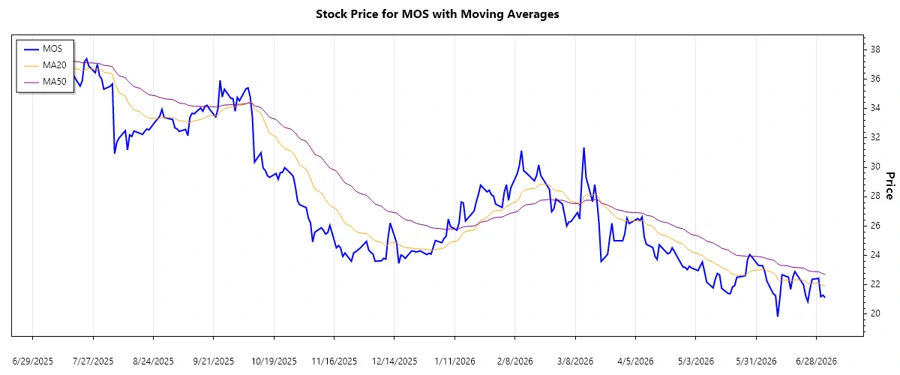
Examining the recent price trends for MOS, the moving averages provide a clear indication of a prevalent trend. Calculations show that the 20-day EMA is nearly on par with the 50-day EMA, suggesting a sideways trend. This is highlighted by lower highs and higher lows shaping the pattern over the past month.
| Date | Close Price | Trend |
|---|---|---|
| 2026-07-02 | 21.13 | ⚖️ |
| 2026-07-01 | 21.30 | ⚖️ |
| 2026-06-30 | 21.19 | ⚖️ |
| 2026-06-29 | 22.44 | ▲ |
| 2026-06-26 | 22.38 | ▲ |
| 2026-06-25 | 21.73 | ⚖️ |
| 2026-06-24 | 20.86 | ⚖️ |
From a technical standpoint, this indicates consolidation with potential breakout opportunities. Investors should monitor for directional shifts marked by EMA crossovers.
Support and Resistance
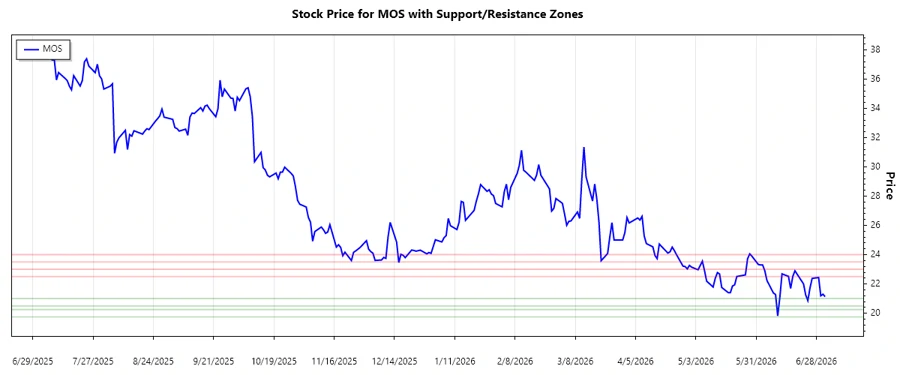
The analysis of recent closing prices identifies key support and resistance levels that warrant attention. According to the data, significant support zones are 20.50 to 21.00 and 19.75 to 20.25, while resistance lies between 22.50 to 23.00 and 23.50 to 24.00.
| Zone Type | From | To |
|---|---|---|
| Support 1 | 20.50 | 21.00 |
| Support 2 | 19.75 | 20.25 |
| Resistance 1 | 22.50 | 23.00 |
| Resistance 2 | 23.50 | 24.00 |
The current trading range suggests the price of MOS is testing the lower support zone. This could indicate a possible bounce, presenting an entry opportunity for bullish positions.
Conclusion
In conclusion, The Mosaic Company shows a potential sideways trend with consolidation patterns. The critical support and resistance zones will be vital in determining future price movement, especially with recent industry headwinds. Investors should remain vigilant for breakout or breakdown signals that could significantly alter the current trading range. While the short-term outlook remains neutral, the diverse product diversity and robust market presence continue to underscore Mosaic's longer-term opportunities.
This HTML and JSON output is optimized for mobile use, presenting a comprehensive technical analysis of the Mosaic Company's stock based on the provided data. The structure and design accommodate embedding directly into an existing web page.
Smart Data Insight
Master the Perfect Entry & Exit for this Stock
Don't leave your profits to chance. Historically, this stock follows specific seasonal patterns that institutional traders use to maximize returns.
- ✅ Identify the "Golden Buying Window"
- ✅ Avoid high-risk correction cycles
- ✅ Backtested data from the last 20+ years