April 30, 2026 a 06:44 am
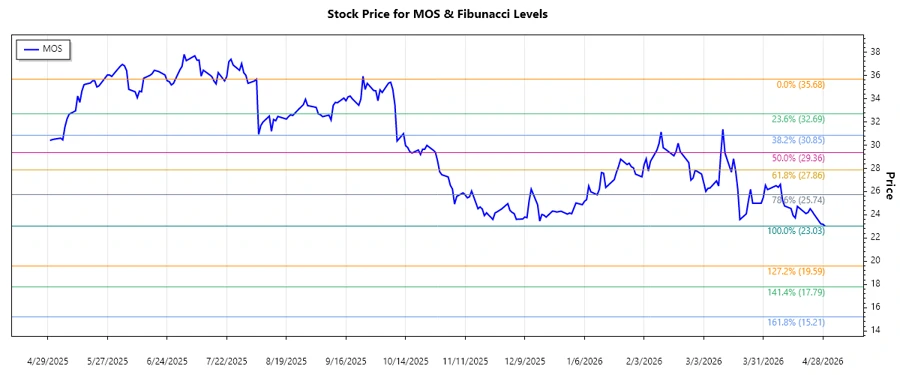
MOS: Fibonacci Analysis - The Mosaic Company
The Mosaic Company shows a complex trend based on the provided data. With a recent downward movement, reflecting challenges in the crop nutrient sector. Nevertheless, the company's robust operating segments contribute to a solid market presence. Investors should analyze technical levels for informed decision-making.
Fibonacci Analysis
| Trend Period | Price Data | Fibonacci Levels | ||||||||||||
|---|---|---|---|---|---|---|---|---|---|---|---|---|---|---|
| Start Date: 2025-12-11 End Date: 2026-04-29 |
High: $35.68 on 2025-08-05 Low: $23.03 on 2026-04-29 |
|
The current price is in the 0.236 retracement zone, which suggests a minor potential support but a cautionary outlook. The stock may face resistance at higher levels given the broader declining trend.
Conclusion
The Mosaic Company's stock is currently in a downward trend marked by significant lower price points. While the Fibonacci retracements suggest potential levels of support and resistance, investors should be cautious given external market factors and challenges in the agricultural sector. The stock may encounter difficulties breaking through higher Fibonacci levels if overall market sentiment remains bearish. That said, strategic recovery in the phosphates and potash market can provide upside potential. Analysts should remain vigilant of sectoral shifts and company-specific advancements.