December 12, 2025 a 02:46 am


MOS: Dividend Analysis - The Mosaic Company
The Mosaic Company, as a notable player in its sector, portrays a firm dividend yield complemented by a consistent dividend history spanning over three decades. Despite the recent setback in dividend stability with a cut in 2024, the company shows potential for recovery given its market strength. This analysis will delve into key dividend metrics, capital efficiencies, and financial stability, providing an in-depth understanding of the company's financial health and future prospects.
📊 Overview
The Mosaic Company operates in a sector that demands stable but competitive dividend yields, with a current yield of 3.65%. Historical records reveal an impressive 34-year tradition of dividends, though the recent 2024 suspension might raise concerns about future continuity. Such characteristics highlight both resilience and risks tied to investing in this stock.
| Key Metrics | Data |
|---|---|
| Sector | Chemicals |
| Dividend Yield | 3.65% |
| Current Dividend Per Share | $0.85 |
| Dividend History | 34 years |
| Last Cut or Suspension | 2024 |
🗣️ Dividend History
Reviewing a company’s dividend history is crucial for assessing its commitment to shareholder returns and overall financial resilience. With a track record spanning 34 years, The Mosaic Company has historically prioritized dividends. Despite the 2024 suspension, past performance showcases its dedication to dividend distribution.
| Year | Dividend Per Share (USD) |
|---|---|
| 2025 | $0.88 |
| 2024 | $0.84 |
| 2023 | $1.05 |
| 2022 | $0.5625 |
| 2021 | $0.275 |
📈 Dividend Growth
Dividend growth is an essential indicator of a company's financial health and its ability to increase shareholder value over time. The Mosaic Company's dividend growth over the past 3 to 5 years has been modest with figures of 0.45% and 0.37%, respectively.
| Time | Growth |
|---|---|
| 3 years | 0.45% |
| 5 years | 0.37% |
The average dividend growth is 0.37% over 5 years. This shows moderate but steady dividend growth. While growth is modest, it suggests stability in dividend policy amid fluctuating market conditions.
💬 Payout Ratio
Evaluating the payout ratio helps understand the sustainability of dividends concerning earnings. An EPS-based payout of 21.86% signifies a conservative approach, indicating room for dividend hikes. However, a concerning -131.89% FCF payout ratio suggests liquidity management issues and potential risks to dividend sustainability.
| Key Figure | Ratio |
|---|---|
| EPS-based | 21.86% |
| Free cash flow-based | -131.89% |
The combination of a viable EPS payout with a troubling FCF payout ratio offers mixed signals on the company's ability to sustain dividends without straining its cash resources.
💵 Cashflow & Capital Efficiency
Understanding cash flow dynamics is critical for assessing a company's ability to fund dividend payouts without compromising capital efficiency. The following metrics provide insights into Mosaic's financial status:
| Year | 2024 | 2023 | 2022 |
|---|---|---|---|
| Free Cash Flow Yield | 0.60% | 8.49% | 17.39% |
| Earnings Yield | 2.22% | 9.84% | 23.17% |
| CAPEX / Operating Cash Flow | 96.35% | 58.26% | 31.69% |
| Stock-based Compensation / Revenue | 0.29% | 0.28% | 0.15% |
| Free Cash Flow / Operating Cash Flow Ratio | 3.65% | 41.74% | 68.31% |
Negative Free Cash Flow yield indicates potential liquidity constraints. Although the Earnings Yield remains adequate, the company needs improvements in capital expenditures to sustain healthier free cash flow.
🏦 Balance Sheet & Leverage Analysis
Balance sheet strength and leverage ratios provide substantial insights into Mosaic's financial robustness and risk levels, crucial for dividend sustainability:
| Year | 2024 | 2023 | 2022 |
|---|---|---|---|
| Debt-to-Equity | 0.39 | 0.33 | 0.32 |
| Debt-to-Assets | 0.19 | 0.17 | 0.16 |
| Debt-to-Capital | 0.28 | 0.25 | 0.24 |
| Net Debt to EBITDA | 2.66 | 1.47 | 0.53 |
| Current Ratio | 1.08 | 1.22 | 1.18 |
| Quick Ratio | 0.47 | 0.57 | 0.54 |
| Financial Leverage | 2.00 | 1.87 | 1.94 |
While The Mosaic Company demonstrates a manageable debt profile with stable ratios, increasing net debt concerning EBITDA poses medium-term risks that require careful monitoring.
📉 Fundamental Strength & Profitability
Profitability metrics emphasize the core financial performance and operational efficiency of The Mosaic Company, fundamental to sustaining dividends:
| Year | 2024 | 2023 | 2022 |
|---|---|---|---|
| Return on Equity | 1.52% | 9.48% | 29.72% |
| Return on Assets | 0.76% | 5.06% | 15.32% |
| Net Margin | 1.57% | 8.51% | 18.73% |
| EBIT Margin | 4.90% | 11.06% | 25.16% |
| EBIATDA Margin | 14.12% | 18.07% | 30.04% |
| Gross Margin | 13.59% | 16.14% | 30.10% |
| R&D / Revenue | 0% | 0% | 0% |
Despite fluctuating but relatively high profitability margins, limited investment in R&D suggests a need for strategic focus to enhance future profitability potential.
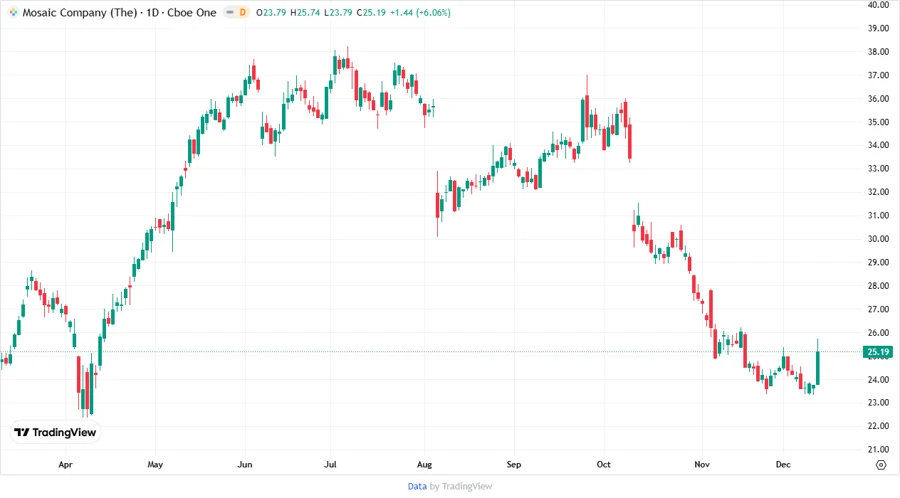
📈 Price Development
The price trajectory of The Mosaic Company has shown significant volatility. Investment strategies should be mindful of price-sensitive market events impacting dividend yields.
✅ Dividend Scoring System
| Criteria | Score | Bar |
|---|---|---|
| Dividend Yield | 4 | |
| Dividend Stability | 2 | |
| Dividend Growth | 2 | |
| Payout Ratio | 3 | |
| Financial Stability | 3 | |
| Dividend Continuity | 3 | |
| Cashflow Coverage | 2 | |
| Balance Sheet Quality | 4 |
Total Score: 23 / 40
🔍 Rating
The Mosaic Company demonstrates a complex dividend portfolio characterized by a strong historical yield yet tainted by recent challenges. Potential investors should weigh these strengths against liquidity risks, limited R&D investment, and operational constraints. While overall financial stability merits consideration, strategies should be attuned to market shifts that impact dividend reliability and growth prospects.