December 11, 2025 a 03:31 pm


MOS: Dividend Analysis - The Mosaic Company
The Mosaic Company presents a respectable dividend profile rooted in a 34-year legacy. Despite a dividend yield of 3.65%, the recent cut in 2024 raises flags for potential adjustments. With a moderate dividend growth over the last five years, investors should weigh these dynamics cautiously against Mosaic’s operational backdrop and sector trends.
Overview 📊
Mosaic operates in the Basic Materials sector and offers a diverse dividend profile with a current yield of 3.65%, making it intriguing for income-focused investors. Below is an overview table summarizing the key dividend metrics:
| Metric | Value |
|---|---|
| Sector | Basic Materials |
| Dividend Yield | 3.65 % |
| Current Dividend per Share | 0.85 USD |
| Dividend History | 34 years |
| Last Cut or Suspension | 2024 |
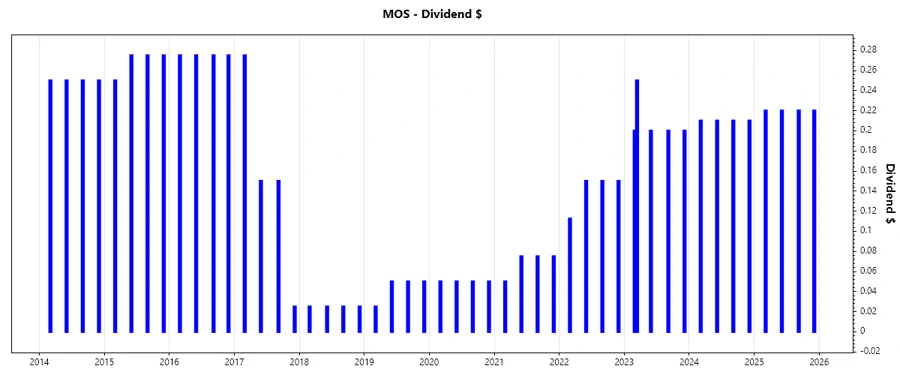
Dividend History 🗣️
Mosaic's dividend history reveals its commitment to delivering shareholder value, albeit with recent fluctuations. This stability is critical for assessing the company's capacity to provide consistent returns.
| Year | Dividend per Share (USD) |
|---|---|
| 2025 | 0.88 |
| 2024 | 0.84 |
| 2023 | 1.05 |
| 2022 | 0.5625 |
| 2021 | 0.275 |
Dividend Growth 📈
Understanding dividend growth trends is crucial for forecasting future income streams and gauging the company's financial health.
| Time | Growth |
|---|---|
| 3 years | 0.45 % |
| 5 years | 0.37 % |
The average dividend growth is 0.37% over 5 years. This shows moderate but steady dividend growth.
Payout Ratio ⚠️
Payout ratios are key indicators of a company's ability to sustain dividend payments without jeopardizing its financial stability.
| Key figure | Ratio |
|---|---|
| EPS-based | 21.86 % |
| Free cash flow-based | -131.89 % |
The EPS-based payout ratio of 21.86% suggests a healthy dividend coverage, while the negative FCF-based ratio warrants a closer examination of cash flow adequacy.
Cashflow & Capital Efficiency ✅
Analyzing cash flow yields insight into the company's liquidity and operational efficiency, essential for evaluating its long-term sustainability and ability to reward shareholders.
| Year | 2024 | 2023 | 2022 |
|---|---|---|---|
| Free Cash Flow Yield | 0.60% | 8.49% | 17.39% |
| Earnings Yield | 2.22% | 9.84% | 23.17% |
| CAPEX to Operating Cash Flow | 96.35% | 58.26% | 31.69% |
| Stock-based Compensation to Revenue | 0.29% | 0.28% | 0.15% |
| Free Cash Flow / Operating Cash Flow Ratio | 3.65% | 41.74% | 68.31% |
The figures indicate a decline in cash flow efficiency in recent years, potentially affecting Mosaic's capital flexibility.
Balance Sheet & Leverage Analysis 📉
A sound balance sheet is a prerequisite for financial resilience, showcasing Mosaic's ability to navigate economic volatilities and sustain its dividend policies.
| Year | 2024 | 2023 | 2022 |
|---|---|---|---|
| Debt-to-Equity | 0.39 | 0.33 | 0.32 |
| Debt-to-Assets | 0.19 | 0.17 | 0.16 |
| Debt-to-Capital | 0.28 | 0.25 | 0.24 |
| Net Debt to EBITDA | 2.66 | 1.47 | 0.53 |
| Current Ratio | 1.14 | 1.23 | 1.18 |
| Quick Ratio | 0.47 | 0.57 | 0.54 |
| Financial Leverage | 2.00 | 1.87 | 1.94 |
Mosaic maintains relatively stable leverage ratios, supporting its financial standing amidst industry challenges.
Fundamental Strength & Profitability 📈
Fundamentals drive long-term profitability and reveal the efficiency of Mosaic's operational strategies in enhancing shareholder value.
| Year | 2024 | 2023 | 2022 |
|---|---|---|---|
| Return on Equity | 1.52% | 9.48% | 29.72% |
| Return on Assets | 0.76% | 5.06% | 15.32% |
| Net Margin | 1.57% | 8.51% | 18.73% |
| EBIT Margin | 4.90% | 11.06% | 25.16% |
| EBITDA Margin | 14.12% | 18.07% | 30.04% |
The historical data indicates a robust profitability profile, affirming the company's value proposition to investors.
Price Development 📉
Dividend Scoring System ✅
| Criteria | Score | Score Bar |
|---|---|---|
| Dividend Yield | 4 | |
| Dividend Stability | 3 | |
| Dividend Growth | 3 | |
| Payout Ratio | 2 | |
| Financial Stability | 4 | |
| Dividend Continuity | 3 | |
| Cashflow Coverage | 2 | |
| Balance Sheet Quality | 4 |
Total Score: 25/40
Rating 🗣️
Mosaic's governance in dividend policy reflects moderate financial stability, evidenced by a fair commitment to yield and profitability amidst variable growth metrics. While the payout ratios and cash flow metrics require cautious optimism, its strong balance sheet provides a buffer against financial uncertainties. Overall, Mosaic presents itself as a moderately balanced dividend stock option.