August 31, 2025 a 12:47 pm


MOS: Dividend Analysis - The Mosaic Company
The Mosaic Company presents a compelling dividend profile for investors seeking moderate yield and growth potential. This analysis will explore the multifaceted aspects of the company's dividend performance and financial health, highlighting its strengths and potential risks. Investors should note the robust dividend history and the company's commitment to payouts while assessing growth prospects and financial stability.
📊 Overview
The Mosaic Company operates in the basic materials sector, featuring a modest dividend yield coupled with an extensive history of dividend payments. The company has shown resilience with no recent cuts or suspensions in its dividend program. This stability could be attractive to income-focused investors.
| Metric | Value |
|---|---|
| Sector | Basic Materials |
| Dividend Yield | 2.60% |
| Current Dividend Per Share | 0.85 USD |
| Dividend History | 34 years |
| Last Cut/Suspension | None |
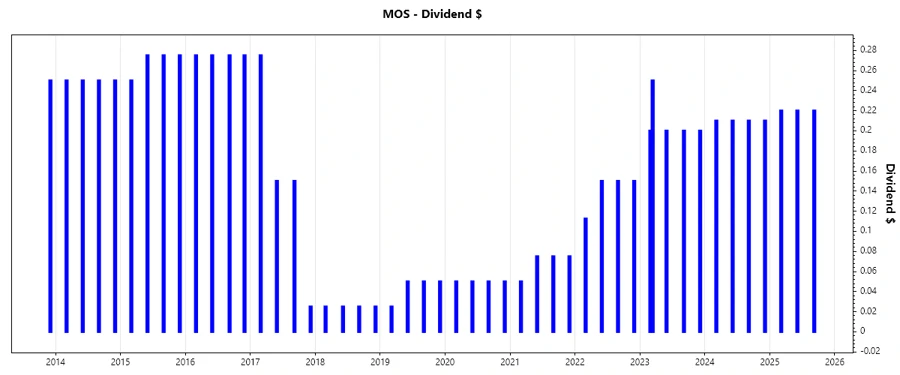
🗓️ Dividend History
Understanding a company's dividend history is crucial as it reflects the firm's ability to consistently return value to shareholders. Mosaic has maintained a regular payout schedule, indicative of financial health and shareholder alignment.
| Year | Dividend Per Share |
|---|---|
| 2025 | 0.66 USD |
| 2024 | 0.84 USD |
| 2023 | 1.05 USD |
| 2022 | 0.5625 USD |
| 2021 | 0.275 USD |
📈 Dividend Growth
The growth of dividends over time is a key indicator of a company's financial health and its management's confidence in future cash flows. Mosaic has demonstrated moderate growth in its dividend payouts, which aligns with its steady performance in its core operations.
| Time | Growth |
|---|---|
| 3 years | 0.45% |
| 5 years | 0.37% |
The average dividend growth is 0.37% over 5 years. This shows moderate but steady dividend growth.
💸 Payout Ratio
Payout ratios offer insights into the sustainability of dividend payments. Mosaic's ratios suggest a cautious approach, aligning dividend payouts closely with financial performance metrics. This discipline is vital for maintaining long-term dividend flow.
| Key Figure | Ratio |
|---|---|
| EPS-based | 28.68% |
| Free Cash Flow-based | 6247.67% |
The payout ratio based on EPS is a manageable 28.68%, indicating a sustainable dividend in relation to net earnings, while the extremely high FCF-based ratio suggests reliance on cash generation capability, requiring careful management.
🏦 Cashflow & Capital Efficiency
Efficient cash flow management underscores a firm’s ability to maintain dividends. Mosaic's performance illustrates its ability to navigate operational cash dynamics, though high reliance on current operating cash flow necessitates ongoing efficiency improvements.
| Metric | 2024 | 2023 | 2022 |
|---|---|---|---|
| Free Cash Flow Yield | 0.60% | 8.49% | 17.39% |
| Earnings Yield | 2.22% | 9.84% | 23.18% |
| CAPEX to Operating Cash Flow | 96.35% | 58.26% | 31.69% |
| Stock-based Compensation to Revenue | 0.03% | 0.28% | 0.15% |
| Free Cash Flow/Operating Cash Flow Ratio | 3.65% | 41.74% | 68.31% |
Mosaic’s cash flow metrics indicate adequate coverage, though pressure on capital efficiency is noted, emphasizing the importance of optimizing expenditure and capital allocation to sustain growth.
💳 Balance Sheet & Leverage Analysis
An examination of the balance sheet provides insights into Mosaic's financial structure, offering confidence in its debt management strategies while elucidating areas of potential leverage.
| Metric | 2024 | 2023 | 2022 |
|---|---|---|---|
| Debt-to-Equity | 0.39 | 0.33 | 0.32 |
| Debt-to-Assets | 0.19 | 0.17 | 0.16 |
| Debt-to-Capital | 0.28 | 0.25 | 0.24 |
| Net Debt to EBITDA | 2.66 | 1.47 | 0.53 |
| Current Ratio | 1.08 | 1.22 | 1.18 |
| Quick Ratio | 0.47 | 0.57 | 0.54 |
| Financial Leverage | 2.00 | 1.87 | 1.94 |
The company's leverage ratios remain stable, suggesting prudent financial management. Mosaic maintains a balanced approach to debt, aligning with stable operational outputs and financial resilience.
💼 Fundamental Strength & Profitability
Mosaic's fundamentals reflect its ability to generate consistent returns and manage operational margins effectively. Understanding these metrics is essential for comprehending its intrinsic value and profitability dynamics.
| Metric | 2024 | 2023 | 2022 |
|---|---|---|---|
| Return on Equity | 1.52% | 9.48% | 29.72% |
| Return on Assets | 0.76% | 5.06% | 15.32% |
| Net Margin | 1.57% | 8.51% | 18.73% |
| EBIT Margin | 4.90% | 11.06% | 25.16% |
| EBITDA Margin | 14.12% | 18.07% | 30.04% |
| Gross Margin | 13.59% | 16.14% | 30.10% |
| Research & Development to Revenue | 0% | 0% | 0% |
Mosaic demonstrates strong profitability metrics, notably in ROE and margins, implying effective scaling of business operations and financial strength.
🌐 Price Development
🏅 Dividend Scoring System
Our scoring system evaluates Mosaic across various dimensions, highlighting areas of strength and opportunity for improvement. This holistic view aids in decision-making for dividend investors.
| Category | Score | |
|---|---|---|
| Dividend Yield | 3 | |
| Dividend Stability | 4 | |
| Dividend Growth | 3 | |
| Payout Ratio | 2 | |
| Financial Stability | 3 | |
| Dividend Continuity | 4 | |
| Cashflow Coverage | 3 | |
| Balance Sheet Quality | 3 |
Total Score: 25/40
🔍 Rating
In conclusion, The Mosaic Company exhibits a robust dividend profile with strong stability and history. However, tighter cash flow management and capital efficiency would further enhance its appeal. Investors seeking stable, moderate-income streams will find Mosaic an appealing choice, while those looking for aggressive growth may need to consider other options.
Smart Data Insight
Master the Perfect Entry & Exit for this Stock
Don't leave your profits to chance. Historically, this stock follows specific seasonal patterns that institutional traders use to maximize returns.
- ✅ Identify the "Golden Buying Window"
- ✅ Avoid high-risk correction cycles
- ✅ Backtested data from the last 20+ years