August 15, 2025 a 12:47 pm


MOS: Dividend Analysis - The Mosaic Company
The Mosaic Company demonstrates a stable dividend history with a current yield of 2.36%. With a significant presence in the agriculture sector, the company's strategic financial maneuvers aim at maintaining a consistent dividend payout. Mosaic's balanced approach between rewards and reinvestment is pivotal for shareholder satisfaction and growth potential.
📊 Overview
The Mosaic Company operates primarily in the agriculture sector, showcasing its resilience through a diverse revenue stream associated with fertilizers and related products. With a dividend yield of 2.36%, the company offers moderate returns to dividend-seeking investors. The recognition of a 34-year dividend history emphasizes its long-standing commitment to shareholders, with no recent cuts or suspensions, ensuring investor trust.
| Sector | Dividend Yield | Current Dividend Per Share | Dividend History | Last Cut / Suspension |
|---|---|---|---|---|
| Agriculture | 2.36% | 0.85 USD | 34 years | None |
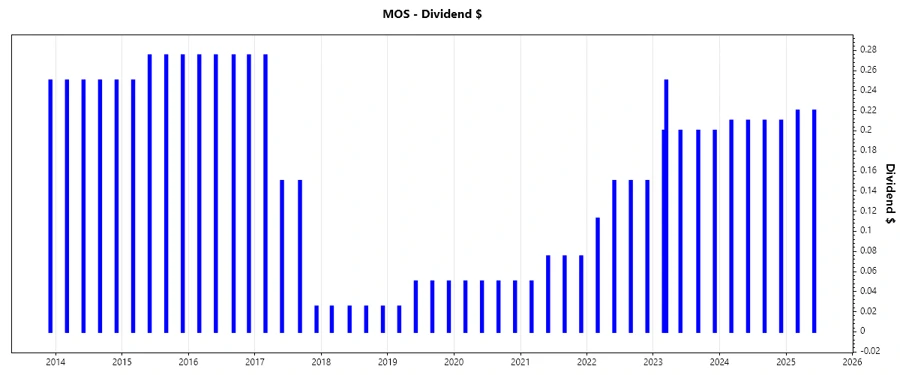
📈 Dividend History
The historical dividend data reflects The Mosaic Company's dedication towards returning value to its shareholders by maintaining uninterrupted payments. Consistency over the years has played a vital role in building investor confidence. Analyzing a company's dividend history can indicate the firm's commitment to returning cash to its equity holders.
| Year | Dividend per Share (USD) |
|---|---|
| 2025 | 0.44 |
| 2024 | 0.84 |
| 2023 | 1.05 |
| 2022 | 0.5625 |
| 2021 | 0.275 |
📈 Dividend Growth
Dividend growth rates are critical for understanding a company's potential for increasing dividend payments over time. Mosaic's performance over the past few years suggests positive momentum in their payout increase. This growing trend points towards enhanced profitability and the firm's emphasis on retaining investor loyalty.
| Time | Growth |
|---|---|
| 3 years | 0.45% |
| 5 years | 0.37% |
The average dividend growth is 0.37% over 5 years. This shows moderate but steady dividend growth.
⚠️ Payout Ratio
Assessing the payout ratio is fundamental for evaluating a company's ability to sustain its dividends. The EPS-based payout ratio is at 28.68%, indicating a healthy balance between returns and reinvestment. However, an exceptionally high Free Cash Flow-based ratio of 6247.67% suggests that while operating earnings cover dividends comfortably, the free cash flow scenario should be monitored closely.
| Key Figure | Ratio |
|---|---|
| EPS-based | 28.68% |
| Free cash flow-based | 6247.67% |
Despite a strong EPS payout ratio, the extremely high FCF payout ratio highlights potential concerns over cash generation capabilities, which the company needs to address strategically.
📊 Cashflow & Capital Efficiency
Cash flow metrics are essential for assessing a company's efficiency and liquidity. Mosaic's financials indicate varied strengths, with particular emphasis on streamlining capital allocation to optimize returns. The focus on maintaining a favorable operating cash flow and judicious CAPEX investments reveals strategic foresight.
| Year | 2024 | 2023 | 2022 |
|---|---|---|---|
| Free Cash Flow Yield | 0.60% | 8.49% | 17.39% |
| Earnings Yield | 2.22% | 9.84% | 23.17% |
| CAPEX to Operating Cash Flow | 96.35% | 58.26% | 31.69% |
| Stock-based Compensation to Revenue | 0.29% | 0.28% | 0.15% |
| Free Cash Flow / Operating Cash Flow Ratio | 3.65% | 41.74% | 68.31% |
The focus on efficient capital allocation and resource mobilization significantly aids in improvising operational flexibility and enhancing shareholder value.
📊 Balance Sheet & Leverage Analysis
An analysis of leverage and liquidity ratios showcases The Mosaic Company's relatively balanced financial structure and debt management practices. With a robust quick ratio and stable current ratio, Mosaic demonstrates adequate liquidity to finance short-term liabilities while managing existing debt obligations responsibly.
| Year | 2024 | 2023 | 2022 |
|---|---|---|---|
| Debt-to-Equity | 38.75% | 32.50% | 31.59% |
| Debt-to-Assets | 19.41% | 17.34% | 16.28% |
| Debt-to-Capital | 27.93% | 24.53% | 24.01% |
| Net Debt to EBITDA | 2.66 | 1.42 | 0.51 |
| Current Ratio | n/a | n/a | 1.18 |
| Quick Ratio | 0.47 | 0.57 | 0.54 |
| Financial Leverage | 1.99 | 1.87 | 1.94 |
Mosaic’s prudent financial overview and careful leverage analysis indicate strong governance of financial obligations, portraying an extended capability to utilize debts effectively while preserving resilience.
📊 Fundamental Strength & Profitability
The company exhibits a solid fundamental base characterized by returns indicative of efficient management and strategic foresight. Relatively high-profit margins signify healthy business operations, which expert management compounds through future growth reinvestments.
| Year | 2024 | 2023 | 2022 |
|---|---|---|---|
| Return on Equity | 1.52% | 9.48% | 29.72% |
| Return on Assets | 0.76% | 5.06% | 15.32% |
| Net Margin | 1.57% | 8.51% | 18.73% |
| EBIT Margin | 4.90% | 11.06% | 25.16% |
| EBITDA Margin | 14.12% | 18.78% | 31.37% |
| Gross Margin | 13.59% | 16.14% | 30.09% |
| R&D to Revenue | 0.00% | 0.00% | 0.00% |
The strong performance indicators denote Mosaic's exceptional strategic capabilities, such as market adaptability and operational innovation, positioning itself as a consistent income generator.
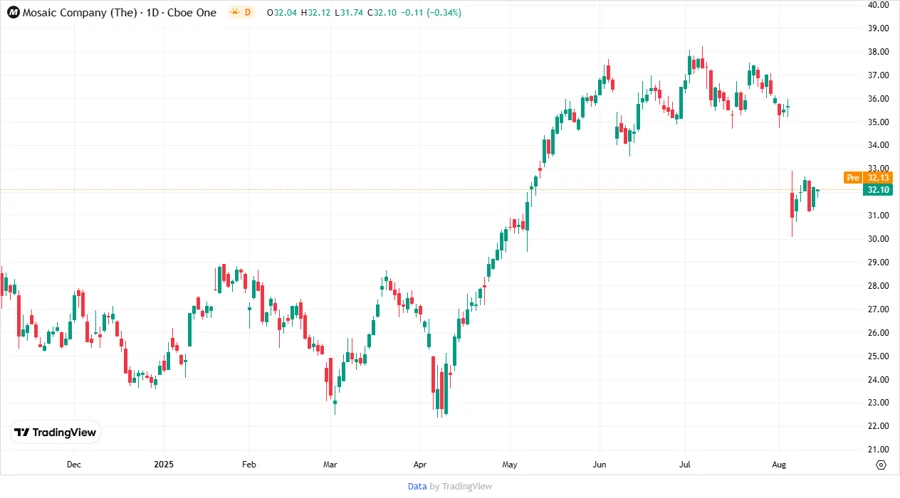
📉 Price Development
📊 Dividend Scoring System
| Criteria | Score | |
|---|---|---|
| Dividend yield | 4 | |
| Dividend Stability | 5 | |
| Dividend growth | 3 | |
| Payout ratio | 2 | |
| Financial stability | 4 | |
| Dividend continuity | 5 | |
| Cashflow Coverage | 3 | |
| Balance Sheet Quality | 4 |
Total Score: 30/40
🗣️ Rating
The Mosaic Company receives a strong recommendation, noted for its stable dividend history, adequate financial leverage management, and strategic cash flow allocation. Investors seeking a balanced dividend investment option may find Mosaic's offerings aligned with moderate growth aspirations and sustainability.