June 17, 2025 a 07:31 am


MOS: Dividend Analysis - The Mosaic Company
The Mosaic Company, a key player in the agricultural sector, offers dividends with an appealing yield of 2.36%. With 34 years of continuous dividend history, it demonstrates commitment to shareholders. Although the recent payout ratios suggest constraints with high free cash flow-based payout, recent growth in dividends provides a positive outlook for long-term investors.
Overview 📊
The Mosaic Company operates within the agricultural sector and provides a notable dividend yield of 2.36%, amongst a 34-year dividend history that underscores stability. The current dividend per share is at 0.85 USD, and there has been no recent cut or suspension, reflecting consistent shareholder value delivery.
| Metric | Value |
|---|---|
| Sector | Agriculture |
| Dividend yield | 2.36% |
| Current dividend per share | 0.85 USD |
| Dividend history | 34 years |
| Last cut or suspension | None |
Dividend History 🗣️
The company’s dividend history is crucial for assessing its reliability in dividend payments. A consistent dividend expansion can signal a company's robust financial health and shareholder commitment.
| Year | Dividend per Share (USD) |
|---|---|
| 2025 | 0.44 |
| 2024 | 0.84 |
| 2023 | 1.05 |
| 2022 | 0.5625 |
| 2021 | 0.275 |
Dividend Growth 📈
Analyzing dividend growth rates helps investors determine the company's potential for future dividend increases and financial growth.
| Time | Growth |
|---|---|
| 3 years | 0.45% |
| 5 years | 0.37% |
The average dividend growth is 0.37% over 5 years. This shows moderate but steady dividend growth.
Payout Ratio 📉
A company's payout ratio provides insights into its sustainability in paying dividends relative to its earnings and cash flow. A high payout ratio may indicate risk to dividend sustainability.
| Key figure | Ratio |
|---|---|
| EPS-based | 72.96% |
| Free cash flow-based | 126.36% |
The elevated FCF-based payout ratio of 126.36% is a concern, indicating potential unviability if not supported by consistent cash flows, whereas the EPS-based ratio of 72.96% suggests comparatively better coverage from earnings.
Cashflow & Capital Efficiency 💰
Understanding cash flow and capital efficiency is essential to evaluating a company’s adaptability in reinvesting core cash flows to foster future growth and sustainability.
| Metric | 2024 | 2023 | 2022 |
|---|---|---|---|
| Free Cash Flow Yield | 0.60% | 8.49% | 17.39% |
| Earnings Yield | 2.22% | 9.84% | 23.17% |
| CAPEX to Operating Cash Flow | 96.35% | 58.26% | 31.69% |
| Stock-based Compensation to Revenue | 0.29% | 0.28% | 0.15% |
| Free Cash Flow / Operating Cash Flow Ratio | 3.65% | 41.74% | 68.31% |
While the cash flow yield and efficiency ratios indicate strong cash position in 2022, the declining trend by 2024 presents potential challenges.
Balance Sheet & Leverage Analysis 📊
Assessment of a firm's balance sheet is crucial for understanding financial health, leverage, and the capacity to support future growth.
| Metric | 2024 | 2023 | 2022 |
|---|---|---|---|
| Debt-to-Equity | 38.75% | 32.50% | 30.05% |
| Debt-to-Assets | 19.41% | 17.34% | 15.49% |
| Debt-to-Capital | 27.93% | 24.53% | 23.10% |
| Net Debt to EBITDA | 2.66x | 1.42x | 0.60x |
| Current Ratio | 1.08 | 1.23 | 1.18 |
| Quick Ratio | 0.47 | 0.57 | 0.54 |
| Financial Leverage | 1.99 | 1.87 | 1.94 |
Maintaining a reasonable debt-to-capital ratio positions the company for long-term resilience, although trends suggest increasing leverage, necessitating careful monitoring.
Fundamental Strength & Profitability ✅
Evaluations of profitability gauges the company's efficiency in generating returns and growth, paramount for long-term investment decisions.
| Metric | 2024 | 2023 | 2022 |
|---|---|---|---|
| Return on Equity | 1.52% | 9.48% | 29.72% |
| Return on Assets | 0.76% | 5.06% | 15.32% |
| Margins: Net | 1.57% | 8.51% | 18.73% |
| EBIT | 4.90% | 11.06% | 25.02% |
| EBITDA | 14.12% | 18.78% | 25.02% |
| Gross | 13.59% | 16.14% | 30.10% |
| R&D to Revenue | 0.00% | 0.00% | 0.00% |
Despite decreased ROE in 2024, historic margins underscore strong underlying fundamentals, showing efficiency in core operations.
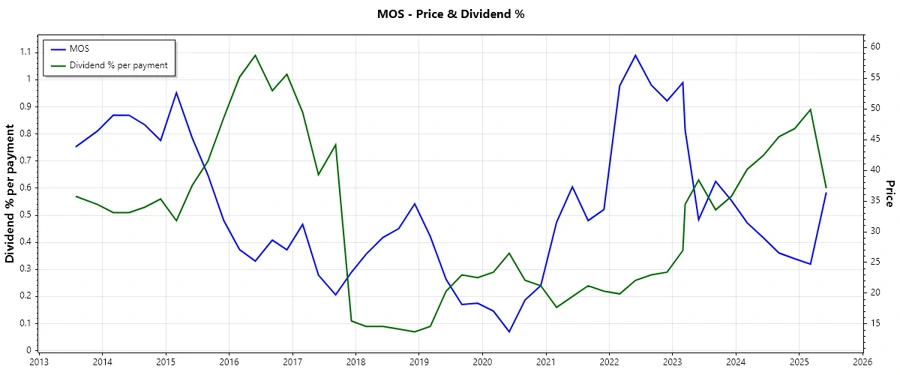
Price Development 📈
Dividend Scoring System 📊
| Criterion | Rating | Score |
|---|---|---|
| Dividend yield | 4 | |
| Dividend Stability | 5 | |
| Dividend growth | 3 | |
| Payout ratio | 2 | |
| Financial stability | 3 | |
| Dividend continuity | 5 | |
| Cashflow Coverage | 3 | |
| Balance Sheet Quality | 3 |
Overall Score: 28/40
Rating 📊
The Mosaic Company offers a solid dividend yield with commendable stability over the years. While there are concerns with high payout ratios and decreasing margins, its long-term dividend continuity and financial stability suggest it remains a viable option for income-focused investors seeking steady growth.
Smart Data Insight
Master the Perfect Entry & Exit for this Stock
Don't leave your profits to chance. Historically, this stock follows specific seasonal patterns that institutional traders use to maximize returns.
- ✅ Identify the "Golden Buying Window"
- ✅ Avoid high-risk correction cycles
- ✅ Backtested data from the last 20+ years