May 24, 2025 a 03:15 am
MMM: Trend and Support & Resistance Analysis - 3M Company
3M Company, a diversified technology company, has shown fluctuating stock performance over the past months. With continuous innovations in various segments such as safety and industrial, transportation and electronics, healthcare, and consumer, the company remains a leader in its field. However, the stock trend over recent months indicates complex market dynamics. Investors need to evaluate technical patterns and market signals before deciding on positioning.
Trend Analysis
| Date | Closing Price | Trend |
|---|---|---|
| 2025-05-23 | 147.62 | ▼ Abwärtstrend |
| 2025-05-22 | 149.78 | ▼ Abwärtstrend |
| 2025-05-21 | 149.4 | ▼ Abwärtstrend |
| 2025-05-20 | 154.15 | ▲ Aufwärtstrend |
| 2025-05-19 | 154.14 | ▲ Aufwärtstrend |
| 2025-05-16 | 153.11 | ▲ Aufwärtstrend |
| 2025-05-15 | 148.74 | ▼ Abwärtstrend |
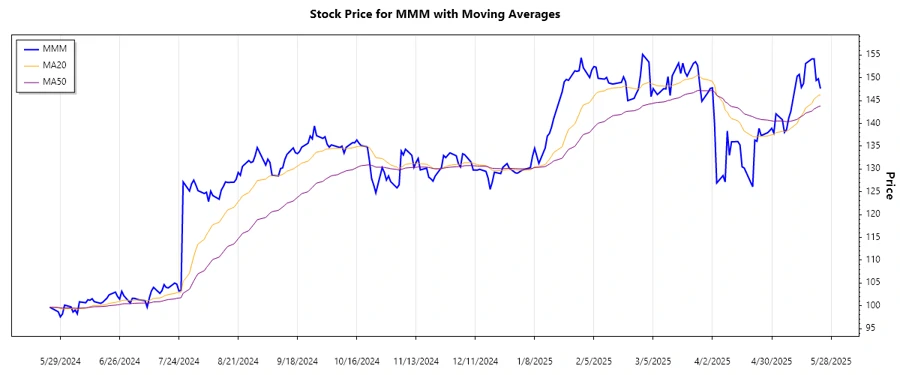
The technical indicators of EMA20 and EMA50 suggest a mostly downward trend in recent days. A responsive market image below provides visual insights:
Support- and Resistance
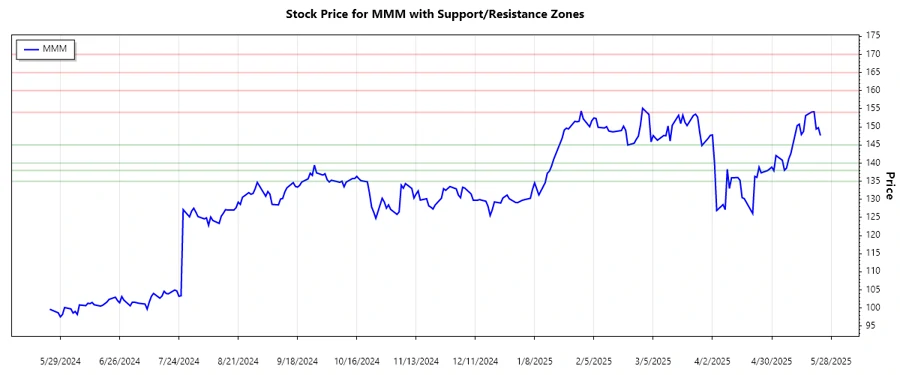
Based on recent stock movements, the primary support levels are around 147 and 142, while resistance levels lie near 154 and 160.
| Zone Type | Lower (From) | Upper (To) |
|---|---|---|
| Support Zone 1 | 140 | 145 |
| Support Zone 2 | 135 | 138 |
| Resistance Zone 1 | 154 | 160 |
| Resistance Zone 2 | 165 | 170 |
The stock is currently hovering near a support zone, a crucial level to watch as it may determine the future direction. Analyzing the support and resistance visually helps in understanding pivotal levels:
Conclusion
3M Company's stock remains volatile, with significant technical signals indicating a mixture of downward and upward pressures. Investors should weigh the risks and opportunities associated with the stock's current trend. Given the proximity to key support zones, it's imperative to consider potential buy signals if these zones hold. As an analyst, staying updated with RSI levels and watching for price action patterns could provide additional insights into buying opportunities or alert for possible downward breakdowns.
Smart Data Insight
Master the Perfect Entry & Exit for this Stock
Don't leave your profits to chance. Historically, this stock follows specific seasonal patterns that institutional traders use to maximize returns.
- ✅ Identify the "Golden Buying Window"
- ✅ Avoid high-risk correction cycles
- ✅ Backtested data from the last 20+ years