
June 27, 2026 a 11:43 am
MMM: Fundamental Ratio Analysis - 3M Company
3M Company, with its vast array of diverse product segments, remains a key player in the technology conglomerate space. Current evaluations indicate a stable yet modest growth potential for its industrial and consumer-facing divisions. Despite some pressure points in financial metrics, its diversified portfolio continues to offer a solid foundation.
Fundamental Rating
3M's fundamental rating stands at a "B", reflecting an overall stable performance across various financial metrics. Each metric presents a varied opportunity profile for investors.
| Category | Score | Visual |
|---|---|---|
| Discounted Cash Flow | 3 | |
| Return on Equity | 5 | |
| Return on Assets | 5 | |
| Debt to Equity | 1 | |
| Price to Earnings | 2 | |
| Price to Book | 1 |
Historical Ratings
Analysis of the historical data shows consistency in some key areas, while others have shown slight fluctuations over time.
| Date | Overall | DCF | ROE | ROA | D/E | P/E | P/B |
|---|---|---|---|---|---|---|---|
| 2026-06-25 | 3 | 3 | 5 | 5 | 1 | 2 | 1 |
| Previous | 0 | 3 | 5 | 5 | 1 | 2 | 1 |
Analysts' Price Targets
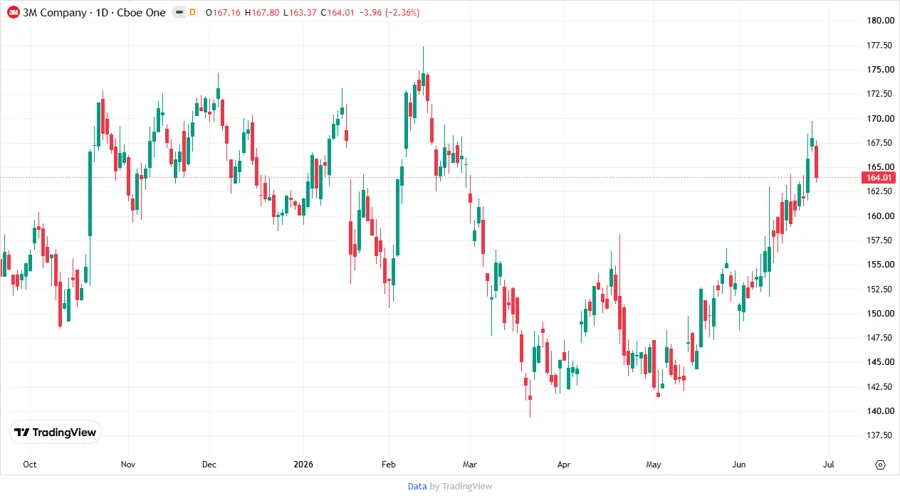
The analyst consensus for 3M's stock price reveals a median target with moderate variance, reflecting varying expectations of future performance.
| High | Low | Median | Consensus |
|---|---|---|---|
| 190 | 136 | 170.5 | 166.75 |
Analysts' Sentiment
The sentiment from analysts currently suggests a hold consensus, though there is a significant proportion of buy recommendations indicating possible value investments.
| Recommendation | Count | Distribution |
|---|---|---|
| Strong Buy | 0 | |
| Buy | 15 | |
| Hold | 17 | |
| Sell | 1 | |
| Strong Sell | 0 |
Conclusion
3M Company continues to exhibit a robust performance across its diversified business segments, although some financial metrics suggest caution. The combination of stable demand across essential sectors and innovative product lines provides growth potential. However, certain financial ratios underline the need for prudent monitoring of its debt management strategies. Overall, while holding potential, investors should weigh the balance of stability against sector-specific challenges.
Smart Data Insight
Master the Perfect Entry & Exit for this Stock
Don't leave your profits to chance. Historically, this stock follows specific seasonal patterns that institutional traders use to maximize returns.
- ✅ Identify the "Golden Buying Window"
- ✅ Avoid high-risk correction cycles
- ✅ Backtested data from the last 20+ years