
July 08, 2026 a 03:31 am


MMM: Dividend Analysis - 3M Company
3M Company, with its global presence in industrial and consumer products, demonstrates a strong historical commitment to shareholders through a substantial dividend history. While recent trends indicate some volatility in dividend growth, the long-term reliability and substantial market cap reinforce its stature as a dividend stalwart. Investors should weigh the dividends in relation to profitability metrics and macroeconomic factors.
📊 Overview
The following section provides key insights into 3M's dividend characteristics, which are crucial for understanding its income-generating potential.
| Key Metric | Value |
|---|---|
| Sector | Conglomerate |
| Dividend yield | 1.98 % |
| Current dividend per share | 2.20 USD |
| Dividend history | 57 years |
| Last cut or suspension | None |
🗣️ Dividend History
The longevity of a company's dividend history can signal stability and commitment to shareholder returns. 3M's impressive record of 57 consecutive years of dividends without interruption is testament to its robust financial health over decades.
| Year | Dividend per Share (USD) |
|---|---|
| 2026 | 1.56 |
| 2025 | 2.92 |
| 2024 | 3.36 |
| 2023 | 5.02 |
| 2022 | 4.98 |
📈 Dividend Growth
Monitoring dividend growth trends over time is critical for projecting future income reliability and sustainability.
| Time Period | Growth |
|---|---|
| 3 years | -16.32 % |
| 5 years | -9.90 % |
The average dividend growth is -9.90 % over 5 years, indicating moderate historical pressure on dividend increases, needing investor consideration.
📉 Payout Ratio
The payout ratio provides insight into the proportion of earnings and free cash used to cover dividend payments, assessing financial flexibility.
| Key Figure | Ratio |
|---|---|
| EPS-based | 41.75 % |
| Free cash flow-based | 55.68 % |
With an EPS payout of 41.75 % and a FCF ratio of 55.68 %, 3M retains adequate earnings for reinvestment while prioritizing shareholder returns.
✅ Cashflow & Capital Efficiency
Analyzing cash flow metrics is crucial for understanding how effectively a company generates cash relative to its capital expenditure needs and debt coverage.
| Year | 2025 | 2024 | 2023 |
|---|---|---|---|
| Free Cash Flow Yield | 1.63 % | 0.90 % | 10.00 % |
| Earnings Yield | 3.80 % | 5.90 % | -13.82 % |
| CAPEX to Operating Cash Flow | 39.46 % | 64.92 % | 24.18 % |
| Stock-based Compensation to Revenue | 0.90 % | 1.18 % | 1.11 % |
| Free Cash Flow / Operating Cash Flow Ratio | 60.54 % | 35.07 % | 75.82 % |
These ratios suggest a moderate cash flow sustainability, with varying pressures from capital expenditure and revenue diversification strategies.
⚠️ Balance Sheet & Leverage Analysis
A robust balance sheet reinforces financial stability while reducing risk from excessive leverage, supporting long-term operational success.
| Year | 2025 | 2024 | 2023 |
|---|---|---|---|
| Debt-to-Equity | 2.75 | 3.56 | 3.48 |
| Debt-to-Assets | 34.28 % | 34.26 % | 33.12 % |
| Debt-to-Capital | 73.34 % | 78.05 % | 77.70 % |
| Net Debt to EBITDA | 1.32 | 1.12 | -1.24 |
| Current Ratio | 1.59 | 1.41 | 1.07 |
| Quick Ratio | 1.33 | 1.08 | 0.81 |
| Financial Leverage | 8.02 | 10.38 | 10.52 |
Despite high debt levels, 3M's liquidity ratios suggest it maintains an adequate buffer for settling short-term obligations.
📈 Fundamental Strength & Profitability
Profitability metrics provide vital information about the company's operational efficiency and its ability to generate returns.
| Year | 2025 | 2024 | 2023 |
|---|---|---|---|
| Return on Equity | 69.12 % | 108.62 % | -145.52 % |
| Return on Assets | 8.61 % | 10.47 % | -13.83 % |
| Net Margin | 13.03 % | 16.98 % | -28.42 % |
| EBIT Margin | 19.93 % | 24.42 % | -42.01 % |
| EBITDA Margin | 23.45 % | 29.40 % | -36.19 % |
| Gross Margin | 39.55 % | 41.02 % | 38.90 % |
| Research & Development to Revenue | 4.69 % | 4.35 % | 4.56 % |
While negative margins in certain years raise concerns, overall profitability and R&D investments indicate sustained operational effectiveness.
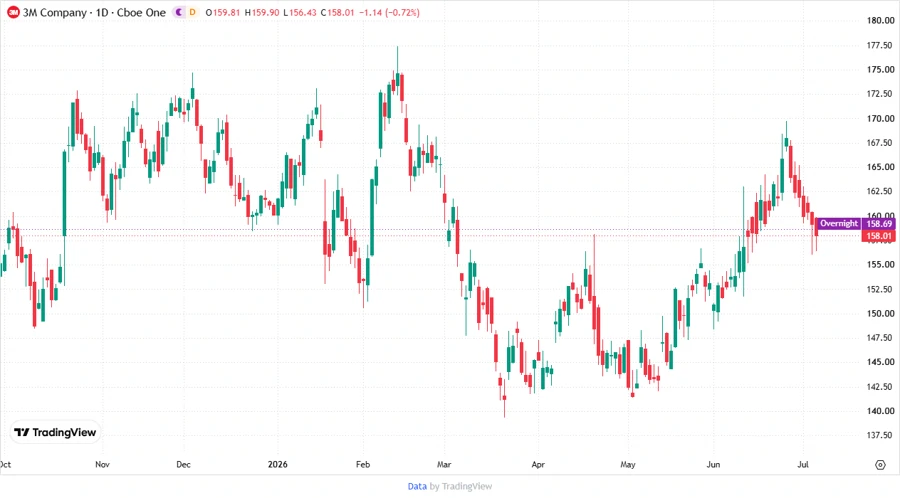
📉 Price Development
✅ Dividend Scoring System
| Category | Score (out of 5) | Score Bar |
|---|---|---|
| Dividend yield | 3 | |
| Dividend Stability | 5 | |
| Dividend growth | 2 | |
| Payout ratio | 4 | |
| Financial stability | 3 | |
| Dividend continuity | 5 | |
| Cashflow Coverage | 4 | |
| Balance Sheet Quality | 3 |
Total Score: 29 out of 40
⚠️ Rating
In conclusion, 3M Company's dividend profile integrates a stable history and adequate coverage, though recent profitability pressures and debt levels may influence future policy adjustments. A hold recommendation is suitable for those valuing consistent income returns in a diversified portfolio.
Smart Data Insight
Master the Perfect Entry & Exit for this Stock
Don't leave your profits to chance. Historically, this stock follows specific seasonal patterns that institutional traders use to maximize returns.
- ✅ Identify the "Golden Buying Window"
- ✅ Avoid high-risk correction cycles
- ✅ Backtested data from the last 20+ years