May 13, 2026 a 03:31 am
MMM: Dividend Analysis - 3M Company
3M Company, a stalwart in the industrial sector, presents a compelling case for income-focused investors with its long-standing history of dividend payments, stretching over 57 consecutive years. Despite recent hurdles, including declines in annual dividend growth, the firm maintains a solid dividend yield of 1.73%, showcasing its commitment to returning capital to shareholders. However, investors should be cautious of the negative growth trajectory in both 3-year and 5-year frames, alongside moderate payout ratios.
📊 Overview
| Attribute | Value |
|---|---|
| Sector | Industrials |
| Dividend Yield | 1.73% |
| Current Dividend per Share | $2.20 USD |
| Dividend History | 57 years |
| Last Cut or Suspension | None |
🗣️ Dividend History
3M Company's robust dividend history underscores its reliability for generating shareholder value over decades. The sustained payment history, absent of cuts, is crucial for investor confidence and provides insight into the firm's financial health.
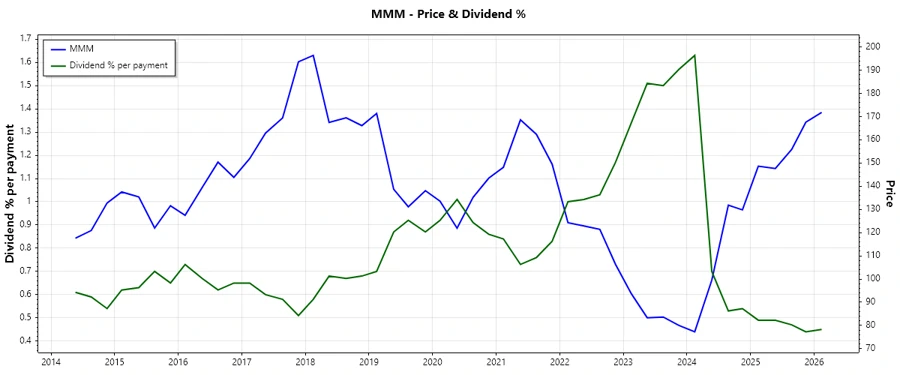
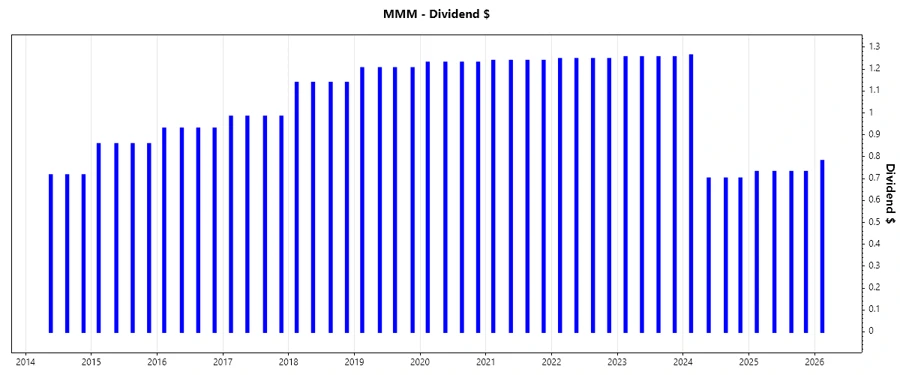
Image: Dividend per Share over Recent Years
| Year | Dividend per Share (USD) |
|---|---|
| 2026 | 0.78 |
| 2025 | 2.92 |
| 2024 | 3.36 |
| 2023 | 5.02 |
| 2022 | 4.98 |
📈 Dividend Growth
The analysis of the dividend growth rates reveals a concerning negative trend over the past 3 and 5 years, indicating challenges in the company's ability to increase payouts sustainably.
| Time Frame | Growth |
|---|---|
| 3 years | -16.32% |
| 5 years | -9.90% |
The average dividend growth is -9.90% over 5 years. This shows moderate but steady dividend growth challenges, highlighting pressure on future increases.
Image: Dividend Growth Rate Chart
⚠️ Payout Ratio
The payout ratio is a key metric for assessing the sustainability of a company's dividend. A lower ratio suggests ample room to maintain and increase dividends, while a higher one may indicate constraints.
| Key Figure | Ratio |
|---|---|
| EPS-based | 41.75% |
| Free Cash Flow-based | 55.68% |
3M's EPS-based payout ratio at 41.75% and FCF-based at 55.68% are moderate, suggesting a balanced approach between rewarding shareholders and retaining capitals for growth.
✅ Cashflow & Capital Efficiency
Evaluating cash flows and capital efficiency is crucial in understanding how well the company generates cash to support operations and strategic investments.
| Year | 2025 | 2024 | 2023 |
|---|---|---|---|
| Free Cash Flow Yield | 1.63% | 0.90% | 10.00% |
| Earnings Yield | 3.80% | 5.87% | -13.82% |
| CAPEX to Operating Cash Flow | 39.46% | 64.93% | 24.18% |
| Stock Compensation to Revenue | 0.90% | 1.18% | 1.11% |
| Free Cash Flow / Operating Cash Flow Ratio | 60.54% | 35.07% | 75.82% |
Stable cash flow yields and efficiency ratios suggest adequate generation of operational cash, albeit with variations that point to the effects of macroeconomic factors and strategic expenditures.
🔍 Balance Sheet & Leverage Analysis
Analyzing leverage ratios and financial stability metrics helps evaluate a company's ability to meet its debt obligations and maintain financial health.
| Year | 2025 | 2024 | 2023 |
|---|---|---|---|
| Debt-to-Equity | 2.75 | 3.56 | 3.48 |
| Debt-to-Assets | 34.28% | 34.26% | 33.12% |
| Debt-to-Capital | 73.34% | 78.05% | 77.70% |
| Net Debt to EBITDA | 1.32 | 1.12 | -1.24 |
| Current Ratio | 1.71 | 1.41 | 1.07 |
| Quick Ratio | 1.33 | 1.08 | 0.81 |
| Financial Leverage | 8.02 | 10.38 | 10.52 |
The leverage ratios suggest a high level of indebtedness, requiring careful monitoring to mitigate potential liquidity risks and ensure continued financial robustness.
💹 Fundamental Strength & Profitability
The evaluation of returns, margins, and efficiency ratios provides insight into a company's ability to generate profits relative to its resources.
| Year | 2025 | 2024 | 2023 |
|---|---|---|---|
| Return on Equity | 69.12% | 108.62% | -145.52% |
| Return on Assets | 8.61% | 10.47% | -13.83% |
| Margins: Net | 13.03% | 16.98% | -28.42% |
| EBIT | 19.93% | 24.42% | -42.01% |
| EBITDA | 23.45% | 29.40% | -36.19% |
| Gross | 39.55% | 41.02% | 38.90% |
| Research & Development / Revenue | 4.68% | 4.35% | 4.56% |
Despite strong fundamental metrics in prior years, recent declines in profitability margins and return on equity reflect challenges in sustaining performance amidst evolving market conditions.
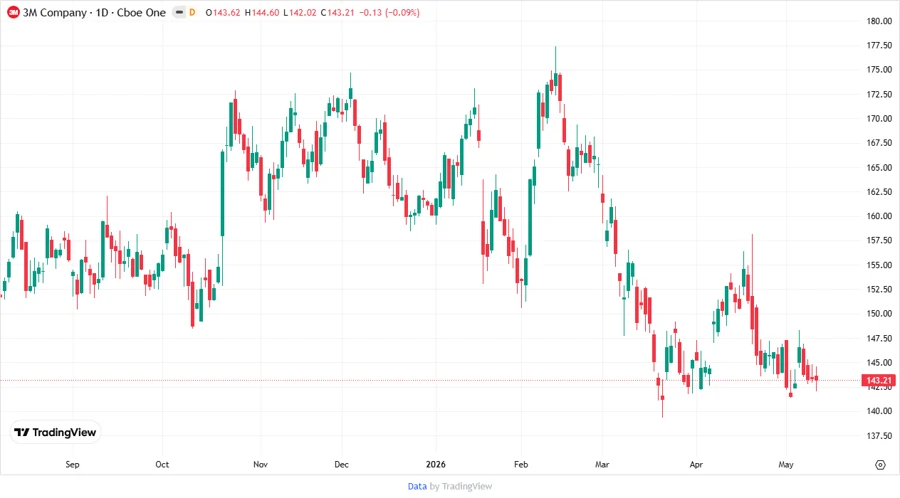
📉 Price Development
Image: Stock Price Development over Recent Years
🎯 Dividend Scoring System
| Category | Score | Visual Representation |
|---|---|---|
| Dividend Yield | 3 | |
| Dividend Stability | 5 | |
| Dividend Growth | 2 | |
| Payout Ratio | 4 | |
| Financial Stability | 3 | |
| Dividend Continuity | 5 | |
| Cashflow Coverage | 4 | |
| Balance Sheet Quality | 3 |
Total Score: 29 / 40
🌟 Rating
3M Company exhibits a long-standing commitment to its dividend platform with commendable stability and continuity. However, the recent negative growth in dividends and the firm's leverage levels pose cautionary tales for potential investors. Investors may find value in 3M's dividend yield and expansive dividend history, but should remain vigilant of underlying financial stresses that could impact future distributions.
Smart Data Insight
Master the Perfect Entry & Exit for this Stock
Don't leave your profits to chance. Historically, this stock follows specific seasonal patterns that institutional traders use to maximize returns.
- ✅ Identify the "Golden Buying Window"
- ✅ Avoid high-risk correction cycles
- ✅ Backtested data from the last 20+ years