
April 18, 2026 a 11:31 am
MMM: Dividend Analysis - 3M Company
The 3M Company, with its well-established history of stable dividends, represents both dividends and financial health. Despite recent challenges, its diversified business model and resilient market position suggest potential for recovery. Recent fluctuations in dividend growth indicate caution, but the company’s robust fundamentals offer hope for long-term investors seeking income stability.
📊 Overview
The overview of 3M's dividend profile reveals a consistent history of dividend payouts, marking its strength in dividend reliability. Key highlights include:
| Description | Details |
|---|---|
| Sector | Manufacturing |
| Dividend Yield | 1.73 % |
| Current Dividend per Share | 2.20 USD |
| Dividend History | 57 years |
| Last Cut or Suspension | None |
📈 Dividend History
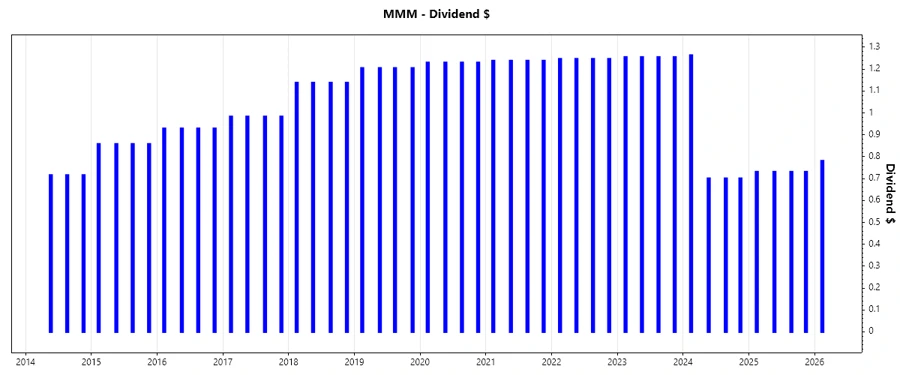
3M's dividend history underscores its commitment to returning value to shareholders. Historical dividends showcase a long-term growth trajectory, beneficial for income-focused investors. The visual below encapsulates recent trends.
| Year | Dividend Per Share (USD) |
|---|---|
| 2026 | 0.78 |
| 2025 | 2.92 |
| 2024 | 3.36 |
| 2023 | 5.02 |
| 2022 | 4.98 |
📉 Dividend Growth
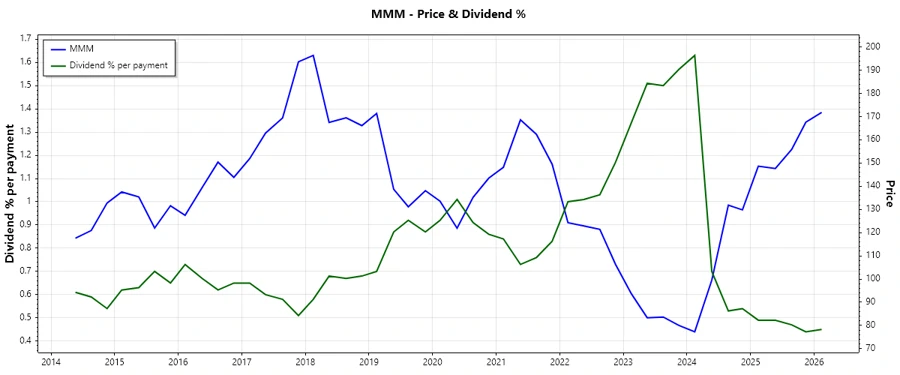
Growth in dividends is indicative of a company's ability to increase shareholder returns over time. While 3M has encountered a negative growth rate recently, the enduring strength of its financial position offers potential for future increase.
| Time | Growth |
|---|---|
| 3 years | -0.16 % |
| 5 years | -0.10 % |
The average dividend growth is -0.10 % over 5 years. This shows a moderate but steady negative trend, suggesting recent financial pressures but not necessarily a long-term indicator.
✅ Payout Ratio
Payout ratios reflect the sustainability of a company's dividends. Analyzing EPS and FCF payout ratios offers insight into financial management and cash flow adequacy.
| Key Figure | Ratio |
|---|---|
| EPS-based | 36.15 % |
| Free cash flow-based | 82.97 % |
The EPS payout ratio indicates careful management of earnings distribution, with a moderate 36.15 %, while the FCF payout ratio suggests higher commitment to paying dividends, raising potential concerns over coverage at 82.97 %.
Cashflow & Capital Efficiency
Understanding cash flow dynamics and capital efficiency is crucial for assessing a company’s financial health and ability to maintain dividend payments.
| Metric | 2023 | 2024 | 2025 |
|---|---|---|---|
| Free Cash Flow Yield | 0.10 % | 0.01 % | 0.02 % |
| Earnings Yield | -13.82 % | 5.87 % | 3.80 % |
| CAPEX to Operating Cash Flow | 24.18 % | 64.93 % | 39.46 % |
| Stock-based Compensation to Revenue | 1.11 % | 1.18 % | 0.90 % |
| Free Cash Flow / Operating Cash Flow Ratio | 75.82 % | 35.07 % | 60.54 % |
The data reveals substantial variability in earnings and cash flow metrics, suggesting caution in cashflow stability and topics like Return on Invested Capital present critical analysis points.
Balance Sheet & Leverage Analysis
Balance sheet clarity and the degree of financial leverage provide insight into long-term debt management and company solvency.
| Metric | 2023 | 2024 | 2025 |
|---|---|---|---|
| Debt-to-Equity | 3.48 | 3.56 | 2.75 |
| Debt-to-Assets | 0.33 | 0.34 | 0.34 |
| Debt-to-Capital | 0.78 | 0.78 | 0.73 |
| Net Debt to EBITDA | -1.24 | 1.11 | 1.32 |
| Current Ratio | 1.07 | 1.41 | 1.71 |
| Quick Ratio | 0.81 | 1.08 | 1.33 |
| Financial Leverage | 10.52 | 10.38 | 8.02 |
Consistent ratios highlight manageable long-term obligations. The current and quick ratios show liquidity suitable for covering short-term liabilities, yet overall leverage indicates potential risks.
Fundamental Strength & Profitability
Profitability ratios and margins illustrate operational efficiency, a vital aspect to maintain during economic fluctuations.
| Metric | 2023 | 2024 | 2025 |
|---|---|---|---|
| Return on Equity | -145.52 % | 108.62 % | 69.12 % |
| Return on Assets | -13.83 % | 10.47 % | 8.61 % |
| Net Margin | -28.42 % | 16.98 % | 13.03 % |
| EBIT Margin | -42.01 % | 24.42 % | 19.93 % |
| EBITDA Margin | -36.19 % | 29.40 % | 23.45 % |
| Gross Margin | 38.90 % | 41.02 % | 39.55 % |
| Research & Development to Revenue | 4.56 % | 4.35 % | 4.69 % |
The data suggest periods of unusually high ROE and adaptable profit margins. The operational margins are a testament to efficient cost management and reinvestment capacity.
Price Development
Dividend Scoring System
| Criteria | Score | Score Bar |
|---|---|---|
| Dividend yield | 2 | |
| Dividend Stability | 5 | |
| Dividend growth | 2 | |
| Payout ratio | 3 | |
| Financial stability | 3 | |
| Dividend continuity | 5 | |
| Cashflow Coverage | 2 | |
| Balance Sheet Quality | 3 |
Total Score: 25/40
🔍 Rating
3M's dividend profile reveals strengths in stability and continuity, paired with challenges in growth and cash flow coverage. The overall assessment should guide investors seeking solid, long-term yield opportunities with some risks. A cautiously optimistic "Hold" recommendation is appropriate given current data.
Smart Data Insight
Master the Perfect Entry & Exit for this Stock
Don't leave your profits to chance. Historically, this stock follows specific seasonal patterns that institutional traders use to maximize returns.
- ✅ Identify the "Golden Buying Window"
- ✅ Avoid high-risk correction cycles
- ✅ Backtested data from the last 20+ years