March 13, 2026 a 11:31 am


MMM: Dividend Analysis - 3M Company
🗣️ The 3M Company boasts a legacy of 57 years of consistent dividends, indicating robustness in its earnings and shareholder returns. Despite a recent dip in dividend growth, 3M's stable payout ratios suggest ongoing financial health. However, investors should be cautious due to potential past disruptions and a mixed recent financial performance.
📊 Overview
3M Company shines with its impressive 57 years of consistent dividend payments, situating it as a stalwart in the industrial sector. The current dividend yield hints at moderate returns, but the long-term commitment to shareholders underscores a resilient dividend strategy.
| Key Metric | Value |
|---|---|
| Sector | Industry |
| Dividend Yield | 1.73% |
| Current Dividend Per Share | 2.20 USD |
| Dividend History | 57 years |
| Last Cut or Suspension | None |
📈 Dividend History
3M Company has shown an ability to maintain a steady dividend payout, providing a reliable income stream that has grown over time. This consistency is a critical factor for those seeking predictable investment returns.
| Year | Dividend Per Share (USD) |
|---|---|
| 2026 | 0.78 |
| 2025 | 2.92 |
| 2024 | 3.36 |
| 2023 | 5.02 |
| 2022 | 4.98 |
📉 Dividend Growth
3M's dividend growth has modestly regressed in recent years. Understanding the negative growth rates is crucial to foresee any potential trajectory changes in shareholder returns.
| Time | Growth |
|---|---|
| 3 years | -16.32% |
| 5 years | -9.90% |
⚠️ The average dividend growth is -9.90% over 5 years. This shows a need for caution as the previous growth sustainability appears compromised.
✅ Payout Ratio
The payout ratio indicates the proportion of earnings and free cash flow paid as dividends. It is vital for assessing dividend safety and sustainability.
| Key Figure | Ratio |
|---|---|
| EPS-based | 36.15% |
| Free Cash Flow-based | 82.97% |
🗣️ With an EPS payout ratio at 36.15%, 3M maintains a conservative dividend payment relative to earnings, yet a high free cash flow-based payout ratio of 82.97% signals a stretched cash utilization strategy.
🧮 Cashflow & Capital Efficiency
Effective cashflow management and capital efficiency can highlight an organization's operational health and its ability to fund dividends from cash resources.
| Metric | 2025 | 2024 | 2023 |
|---|---|---|---|
| Free Cash Flow Yield | 1.63% | 0.90% | 10.00% |
| Earnings Yield | 3.80% | 5.87% | -13.82% |
| CAPEX to Operating Cash Flow | 39.46% | 64.93% | 24.18% |
| Stock-based Compensation to Revenue | 0.90% | 1.18% | 1.11% |
| Free Cash Flow / Operating Cash Flow Ratio | 60.54% | 35.07% | 75.82% |
✅ While 3M's ability to generate free cash appears strong in recent financial periods, the cash flow efficiency metrics indicate fluctuating optimization practices affecting reinvestment capacity.
💸 Balance Sheet & Leverage Analysis
Understanding the leverage levels and balance sheet health is crucial to assess the organization's ability to sustain its dividend payouts under different market conditions.
| Metric | 2025 | 2024 | 2023 |
|---|---|---|---|
| Debt-to-Equity | 2.75 | 3.56 | 3.48 |
| Debt-to-Assets | 34.28% | 34.26% | 33.12% |
| Debt-to-Capital | 73.34% | 78.05% | 77.70% |
| Net Debt to EBITDA | 1.32 | 1.12 | -1.24 |
| Current Ratio | 1.71 | 1.41 | 1.07 |
| Quick Ratio | 1.33 | 1.08 | 0.81 |
| Financial Leverage | 8.02 | 10.38 | 10.52 |
⚠️ 3M maintains a high leverage strategy, which, coupled with moderate liquidity levels, necessitates vigilance in debt management strategies for future dividend stability.
🔍 Fundamental Strength & Profitability
The profitability metrics and fundamental fortitude reflect the ability to generate returns on investments, critical for sustained dividend growth.
| Metric | 2025 | 2024 | 2023 |
|---|---|---|---|
| Return on Equity | 69.12% | 108.62% | -145.52% |
| Return on Assets | 8.61% | 10.47% | -13.83% |
| Net Margin | 13.03% | 16.98% | -28.42% |
| EBIT Margin | 19.93% | 24.42% | -42.01% |
| EBITDA Margin | 23.45% | 29.40% | -36.19% |
| Gross Margin | 39.55% | 41.02% | 38.90% |
| Research & Development to Revenue | 4.69% | 4.35% | 4.56% |
✅ While profitability metrics pose an intriguing picture with variations, especially in the last fiscal year, the depth of margins underscores a potentially valuable operational efficiency.
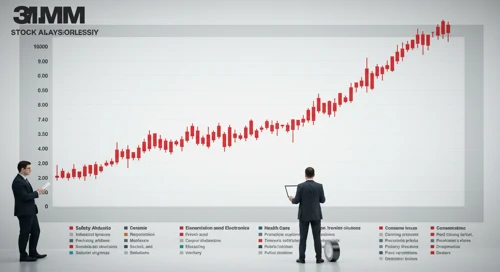
📊 Price Development
🔍 Dividend Scoring System
| Criterion | Rating | Score |
|---|---|---|
| Dividend Yield | 3 | |
| Dividend Stability | 4 | |
| Dividend Growth | 2 | |
| Payout Ratio | 3 | |
| Financial Stability | 3 | |
| Dividend Continuity | 5 | |
| Cashflow Coverage | 3 | |
| Balance Sheet Quality | 2 |
Total Score: 25/40
🗣️ Rating
While 3M remains a steadfast choice for long-term dividend investors due to its historical resilience and steady yield, cautious monitoring of its financial leverages and growth strategies is advised. The moderate overall dividend score signals potential for improvement, situating it as a solid yet challenging investment choice within an evolving market landscape.
Smart Data Insight
Master the Perfect Entry & Exit for this Stock
Don't leave your profits to chance. Historically, this stock follows specific seasonal patterns that institutional traders use to maximize returns.
- ✅ Identify the "Golden Buying Window"
- ✅ Avoid high-risk correction cycles
- ✅ Backtested data from the last 20+ years