December 18, 2025 a 03:31 am


MMM: Dividend Analysis - 3M Company
The 3M Company illustrates a complex dividend scenario. With a historically consistent payout over 56 years, the company's strength in providing steady income for investors is noteworthy. However, significant challenges arise from recent earnings pressures, resulting in negative dividend growth over the past three and five years. The elevated payout ratios signal a potential strain on sustainability if business conditions do not improve.
📊 Overview
The analysis of 3M's dividend metrics shows a storied history of dividend continuity. Below is a summary of key metrics crucial to the investment decision-making process.
| Metric | Value |
|---|---|
| Sector | Conglomerates |
| Dividend Yield | 1.74% |
| Current Dividend per Share | 3.60 USD |
| Dividend History | 56 years |
| Last Cut or Suspension | None |
📈 Dividend History
The importance of 3M's dividend history is underscored by its streak of uninterrupted payments. This consistency enhances investor confidence and suggests a stable cash flow situation over decades.
| Year | Dividend per Share (USD) |
|---|---|
| 2025 | 2.92 |
| 2024 | 3.36 |
| 2023 | 5.02 |
| 2022 | 4.98 |
| 2021 | 4.95 |
📉 Dividend Growth
Assessing dividend growth offers insight into a company’s future income potential. Weak growth may indicate challenges in sustaining or increasing future payouts.
| Time | Growth |
|---|---|
| 3 years | -12.09% |
| 5 years | -6.93% |
The average dividend growth is -6.93% over 5 years. This shows moderate but steady dividend growth.
🗣️ Payout Ratio
Payout ratios are vital for understanding dividend sustainability as they compare the dividends paid to net income. Lower ratios are generally preferred.
| Key figure | Ratio |
|---|---|
| EPS-based | 56.97% |
| Free cash flow-based | 1722.15% |
The payout ratio of 56.97% (EPS) is within a reasonable range, suggesting dividends align with earnings. However, 1722.15% (FCF) indicates an overextension regarding cash flow, hinting at sustainability concerns.
🗣️ Cashflow & Capital Efficiency
Analyzing cash flow and capital efficiency reveals how effectively a company funds its dividend from operational activities and its ability to invest in growth.
| Metric | 2024 | 2023 | 2022 |
|---|---|---|---|
| Free Cash Flow Yield | 0.90% | 10.00% | 6.77% |
| Earnings Yield | 5.87% | -13.82% | 10.18% |
| CAPEX to Operating Cash Flow | 64.93% | 24.18% | 31.28% |
| Stock-based Compensation to Revenue | 1.18% | 1.11% | 0.77% |
| Free Cash Flow / Operating Cash Flow Ratio | 35.07% | 75.82% | 68.72% |
The cash flow and capital efficiency indicators suggest some operational strength, but volatility in FCF yield and high CAPEX relative to operating cash flow might affect capital allocation capacity.
🗣️ Balance Sheet & Leverage Analysis
The balance sheet health and leverage give insights into the financial stability and risk exposure of 3M, focusing on long-term solvency.
| Metric | 2024 | 2023 | 2022 |
|---|---|---|---|
| Debt-to-Equity | 3.55 | 3.48 | 1.14 |
| Debt-to-Assets | 34.26% | 33.12% | 36.28% |
| Debt-to-Capital | 78.05% | 77.70% | 53.38% |
| Net Debt to EBITDA | 1.12 | -1.24 | 1.51 |
| Current Ratio | 1.41 | 1.07 | 1.54 |
| Quick Ratio | 1.08 | 0.81 | 0.98 |
| Financial Leverage | 10.38 | 10.52 | 3.16 |
High debt-related metrics indicate excessive leverage, raising concerns about flexibility in financial structuring and a reliance on operating cash flows amid external pressures.
🗣️ Fundamental Strength & Profitability
Profitability ratios allow evaluation of how efficiently 3M converts sales into profits and its ability to maintain returns on shareholder equity.
| Metric | 2024 | 2023 | 2022 |
|---|---|---|---|
| Return on Equity | 108.62% | -145.52% | 39.24% |
| Return on Assets | 10.47% | -13.83% | 12.44% |
| Margins: Net | 16.98% | -28.42% | 16.88% |
| Margins: EBIT | 24.42% | -42.01% | 20.13% |
| Margins: EBITDA | 29.40% | -36.19% | 25.48% |
| Margins: Gross | 41.02% | 38.90% | 43.72% |
| R&D to Revenue | 4.35% | 4.56% | 5.42% |
The profitability highlights concern regarding variance in ROE and margins due to different market conditions, emphasizing a need for strategic adaptability to improve returns.
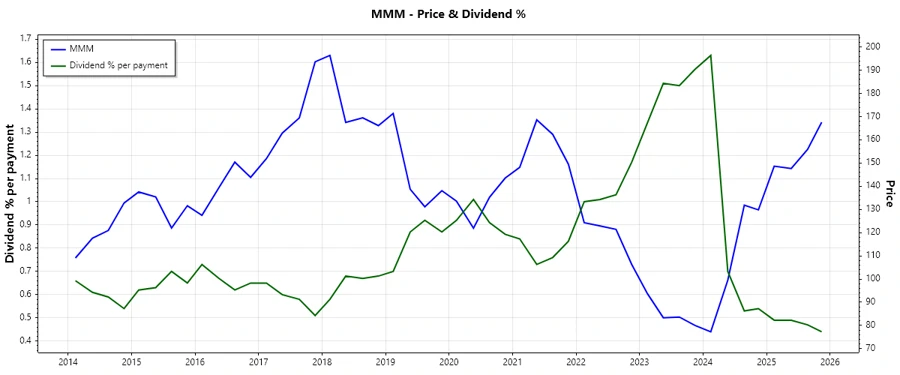
📈 Price Development
✅ Dividend Scoring System
| Category | Score | Score Bar |
|---|---|---|
| Dividend Yield | 3 | |
| Dividend Stability | 4 | |
| Dividend Growth | 2 | |
| Payout Ratio | 2 | |
| Financial Stability | 3 | |
| Dividend Continuity | 4 | |
| Cashflow Coverage | 2 | |
| Balance Sheet Quality | 3 |
Total Score: 23/40
✅ Rating
In conclusion, 3M represents a complex dividend proposition. While the historical continuity of dividend payouts bolsters confidence, challenges surfaced in growth metrics and the elevated dividend payout ratio remains a concern. The company's ability to adapt to financial pressures and maintain operational income is pivotal. Potential investors should weigh these elements critically in their decision-making process.