November 01, 2025 a 07:46 am

MMM: Dividend Analysis - 3M Company
3M Company's dividend profile is a significant aspect of its overall financial attractiveness. With a historically consistent dividend payment history spanning over 56 years, it represents stability and investor confidence. However, it's vital to assess recent growth rates and payout ratios for comprehensive evaluation. The current market conditions and strategic decisions will further influence future dividend prospects.
Overview 📊
The 3M Company operates within a diverse industrial sector, which influences its dividend distribution capability. The company's recent dividend yield stands at 1.85%, accompanied by a current dividend per share of $3.60. With a commendable track record of 56 consecutive years of dividend payments, the last known alteration in dividend policy shows no recent cuts or suspensions.
| Parameter | Value |
|---|---|
| Sector | Industrial Goods |
| Dividend yield | 1.85% |
| Current dividend per share | 3.60 USD |
| Dividend history | 56 years |
| Last cut or suspension | None |
Dividend History 🗣️
The examination of dividend history provides insights into the company's commitment to rewarding shareholders. A consistent history is a hallmark of financial discipline and reliability. This track record supports investor trust and stabilizes perceived risk, even amidst market fluctuations.
| Year | Dividend Per Share (USD) |
|---|---|
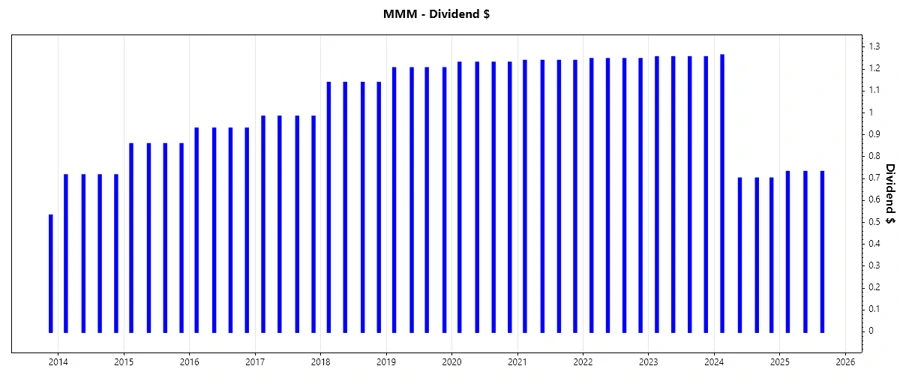
| 2025 | 2.19 |
| 2024 | 3.36 |
| 2023 | 5.02 |
| 2022 | 4.98 |
| 2021 | 4.95 |
Dividend Growth 📈
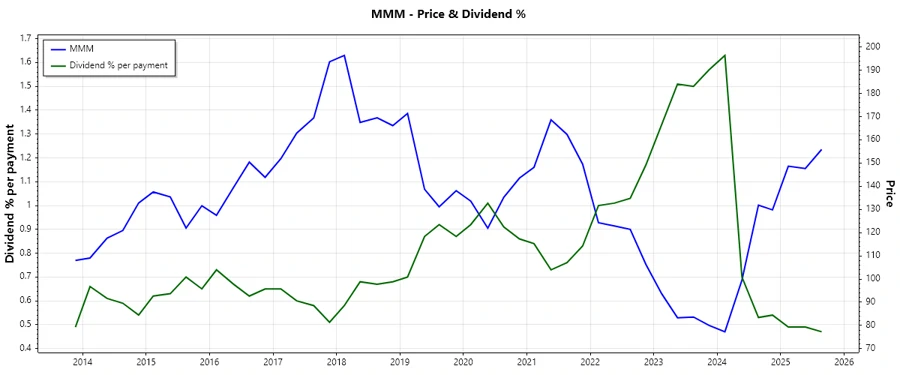
Dividend growth rate is central to evaluating potential income enhancement over time. For 3M, the growth over three years is -0.12% and over five years is -0.07%. This indicates a slight decline in growth, emphasizing the need for strategic adjustments to resume upward momentum in shareholder distributions.
| Time | Growth |
|---|---|
| 3 years | -0.12% |
| 5 years | -0.07% |
The average dividend growth is -6.93% over 5 years. This shows moderate but steady dividend growth.
Payout Ratio 🧮
The payout ratio reveals how much of earnings and free cash flow are distributed as dividends. For 3M, the EPS-based payout ratio is 56.97%, and the free cash flow-based ratio is extraordinarily high at 1722.15%. While the EPS-based ratio is reasonably healthy, the FCF payout suggests potential sustainability issues if the pattern continues.
| Key figure | Ratio |
|---|---|
| EPS-based | 56.97% |
| Free cash flow-based | 1722.15% |
The EPS ratio is within a sustainable range, but the FCF-based ratio is alarmingly high, suggesting immediate attention to underlying cash flow management.
Cashflow & Capital Efficiency 💵
The metrics for cash flow and capital efficiency are crucial for assessing financial health. They reflect the company's ability to generate cash and manage capital expenses prudently. The Free Cash Flow Yield and Earnings Yield indicate limited cash flow generation relative to earnings.
| Metric | 2024 | 2023 | 2022 |
|---|---|---|---|
| Free Cash Flow Yield | 0.009% | 10.0% | 6.77% |
| Earnings Yield | 5.87% | -13.82% | 10.18% |
| CAPEX to Operating Cash Flow | 64.93% | 24.18% | 31.28% |
| Stock-based Compensation to Revenue | 0.0118 | 0.0111 | 0.0077 |
| Free Cash Flow / Operating Cash Flow Ratio | 35.07% | 75.82% | 68.72% |
Indicators reflect volatile cash flow trends and a need for strategic focus on cash management. The high Capex ratio and varying earnings yield suggest prudent resource allocation is critical for future stability.
Balance Sheet & Leverage Analysis 📉
Analyzing the balance sheet reveals financial leverage and risk exposure. With debts surpassing equity, the debt-to-equity ratio, among others, illustrates 3M's significant leverage. Particularly detailed attention is required towards its Debt-to-Capital.
| Metric | 2024 | 2023 | 2022 |
|---|---|---|---|
| Debt-to-Equity | 3.56 | 3.48 | 1.14 |
| Debt-to-Assets | 34.26% | 33.12% | 36.28% |
| Debt-to-Capital | 78.05% | 77.70% | 53.38% |
| Net Debt to EBITDA | 1.12 | -1.24 | 1.51 |
| Current Ratio | 1.41 | 1.07 | 1.54 |
| Quick Ratio | 1.08 | 0.81 | 0.98 |
| Financial Leverage | 10.38 | 10.52 | 3.16 |
3M Company's high leverage ratios require close monitoring as they could undermine financial flexibility in adverse market conditions. The significant dependency on debt financing needs prudent management.
Fundamental Strength & Profitability ✨
The company's profitability and fundamental strength are key indicators of its capability to sustain and enhance dividend payments. High margins can buffer against revenue fluctuations, ensuring consistent shareholder returns.
| Metric | 2024 | 2023 | 2022 |
|---|---|---|---|
| Return on Equity | 1.09 | -1.46 | 0.39 |
| Return on Assets | 0.10 | -0.14 | 0.12 |
| Margins: Net | 16.98% | -28.42% | 16.88% |
| EBIT Margin | 24.42% | -42.01% | 20.13% |
| EBITDA Margin | 29.40% | -36.19% | 25.48% |
| Research & Development to Revenue | 0.0435 | 0.0456 | 0.0542 |
The company's profitability has seen variations, with negative performance in 2023 suggesting operational challenges. The R&D investment is maintained, underscoring future innovation potential.
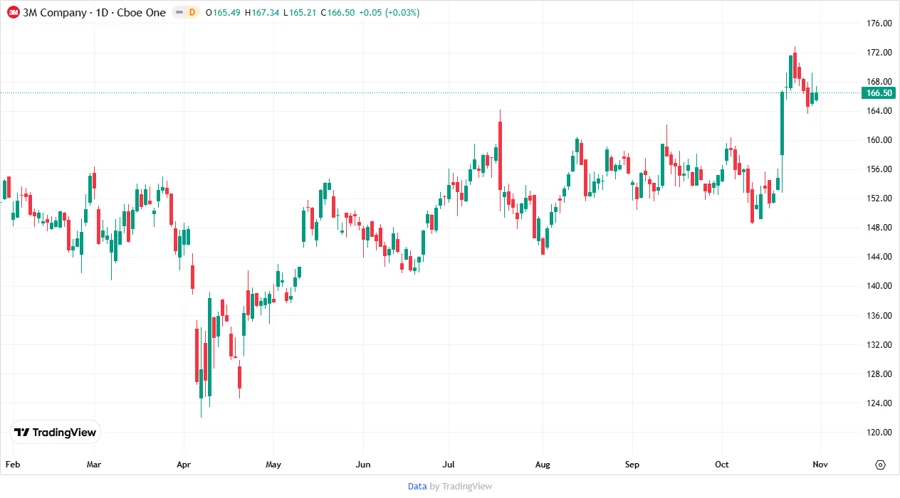
Price Development 📈
Dividend Scoring System ✅
The following scoring assesses various critical dividend metrics using a 1 to 5 rating system.
| Category | Score | Rating |
|---|---|---|
| Dividend yield | 2 | |
| Dividend Stability | 4 | |
| Dividend growth | 2 | |
| Payout ratio | 3 | |
| Financial stability | 3 | |
| Dividend continuity | 5 | |
| Cashflow Coverage | 1 | |
| Balance Sheet Quality | 2 |
Total Score: 22/40
Rating 🏆
3M Company's dividend analysis reveals a delicate balance between historical stability and recent performance challenges. While its extended history of consistent dividends reinforces shareholder confidence, the current yield and limited growth require strategic agility. The high payout ratios and leveraging demand careful management to sustain dividends. Thus, 3M represents a cautious 'Hold' for dividend-focused portfolios, with particular attention to its operational and financial adjustments. Rebalancing towards enhanced cash flow efficiency and debt moderation will be instrumental in maximizing future dividend prospects.