October 19, 2025 a 03:31 am
MMM: Dividend Analysis - 3M Company
📊 In this comprehensive dividend analysis, we will explore 3M Company's dividend sustainability, growth prospects, and overall financial health. Despite recent challenges in growth and cash flow statements, 3M remains a robust entity with a commendable history of consistent dividend payouts. Let's examine the key metrics to assess the viability of this investment.
Overview
3M Company is a stalwart in the industrial sector, renowned for its innovative products and commitment to shareholder returns. As of today, it boasts a significant dividend yield of 1.85%, offering a dividend per share of 3.60 USD. With a solid dividend history of 56 consecutive years, it stands as a testament to the company's stability. Notably, there have been no recent cuts or suspensions, underscoring 3M's reliability in maintaining its dividend payouts.
| Metric | Value |
|---|---|
| Sector | Industrial |
| Dividend Yield | 1.85% |
| Current Dividend per Share | 3.60 USD |
| Dividend History | 56 years |
| Last Cut or Suspension | None |
Dividend History
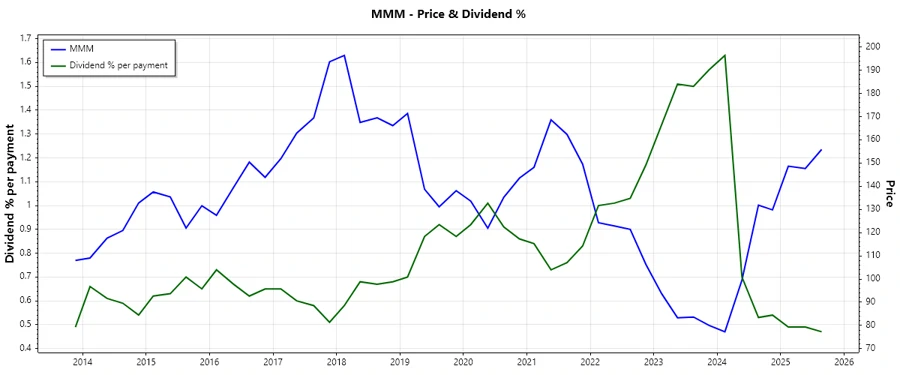
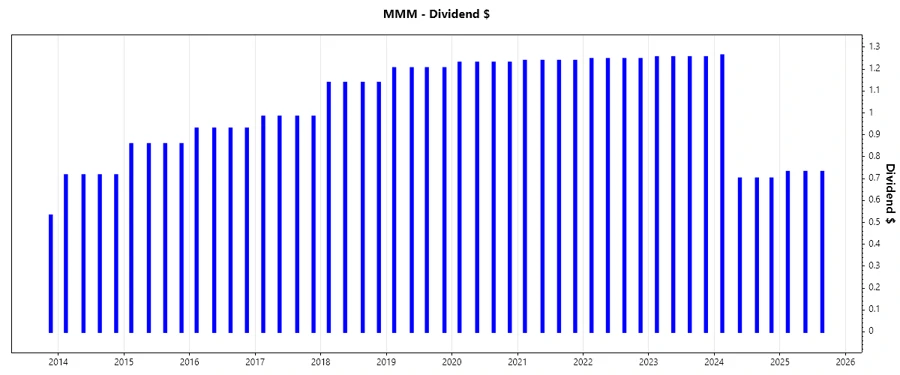
🗣️ Tracking dividend payments over the years allows investors to gauge a company's dedication to returning capital to shareholders. 3M's long-standing history of 56 years provides confidence in its commitment. Below is a snapshot of the most recent dividend payments.
| Year | Dividend per Share (USD) |
|---|---|
| 2025 | 2.19 |
| 2024 | 3.36 |
| 2023 | 5.02 |
| 2022 | 4.98 |
| 2021 | 4.95 |
Dividend Growth
📈 Dividend growth over time is vital for beating inflation and ensuring increased returns. However, 3M has experienced a decline in its growth rates over both 3 and 5-year spans, indicating challenges in operational expansion and market conditions.
| Time | Growth |
|---|---|
| 3 years | -12.09% |
| 5 years | -6.93% |
The average dividend growth is -6.93% over 5 years. This shows a negative growth, revealing pressures on maintaining previous growth levels.
Payout Ratio
⚠️ Payout ratios inform about the sustainability of dividends by comparing dividends against profits and cash flow. A balanced ratio suggests stable future dividend payments. A concerning FCF-based payout ratio can indicate financial distress.
| Key Figure | Ratio |
|---|---|
| EPS-based | 49.39% |
| Free Cash Flow-based | -96.65% |
While the EPS-based payout ratio remains within a healthy range, the negative FCF-based ratio raises concerns about cash flow adequacy to sustain dividends.
Cashflow & Capital Efficiency
✅ Reviewing cash flow metrics explains an organization's capacity to fund dividends without hampering operations. It is essential to ensure cash flows not only cover dividends but also reinvestment and debt obligations. Here's an overview of the recent financial year.
| Metric | 2022 | 2023 | 2024 |
|---|---|---|---|
| Free Cash Flow Yield | 6.77% | 10.00% | 0.90% |
| Earnings Yield | 10.18% | -13.82% | 5.87% |
| CAPEX to Operating Cash Flow | 31.28% | 24.18% | 64.93% |
| Stock-based Compensation to Revenue | 0.77% | 1.11% | 1.18% |
| Free Cash Flow / Operating Cash Flow | 68.72% | 75.82% | 35.07% |
3M's cash flow situation requires attention, particularly regarding reinvestment rates and cash flow yield fluctuations, which might affect the company's ability to cover dividends consistently.
Balance Sheet & Leverage Analysis
📉 Analyzing leverage ratios and balance sheet metrics offers insights into the financial risk associated with a company's operations. A robust balance sheet bodes well for dividend stability and growth potential.
| Metric | 2022 | 2023 | 2024 |
|---|---|---|---|
| Debt-to-Equity | 1.14 | 3.48 | 3.55 |
| Debt-to-Assets | 0.36 | 0.33 | 0.34 |
| Debt-to-Capital | 0.53 | 0.78 | 0.78 |
| Net Debt to EBITDA | 1.51 | -1.24 | 1.12 |
| Current Ratio | 1.54 | 1.07 | 1.41 |
| Quick Ratio | 0.98 | 0.81 | 1.08 |
| Financial Leverage | 3.16 | 10.52 | 10.38 |
The increase in Debt-to-Equity metrics highlights rising leverage, potentially increasing financial strain if earnings do not recover adequately.
Fundamental Strength & Profitability
🗣️ Robust profitability metrics and efficient use of capital are vital for ensuring long-term sustainability and shareholder wealth creation. A healthy balance between these elements supports ongoing dividend payments.
| Metric | 2022 | 2023 | 2024 |
|---|---|---|---|
| Return on Equity | 39.24% | -145.52% | 108.62% |
| Return on Assets | 12.44% | -13.83% | 10.47% |
| Margins: Net | 16.88% | -28.42% | 16.98% |
| EBIT Margin | 20.13% | -42.01% | 24.42% |
| EBITDA Margin | 25.48% | -36.18% | 29.40% |
| Gross Margin | 43.72% | 38.90% | 41.02% |
| R&D to Revenue | 5.42% | 4.56% | 4.35% |
While certain profitability measures have shown volatility, the company's focus on R&D continues to provide a buffer for enhancing competitiveness and margins.
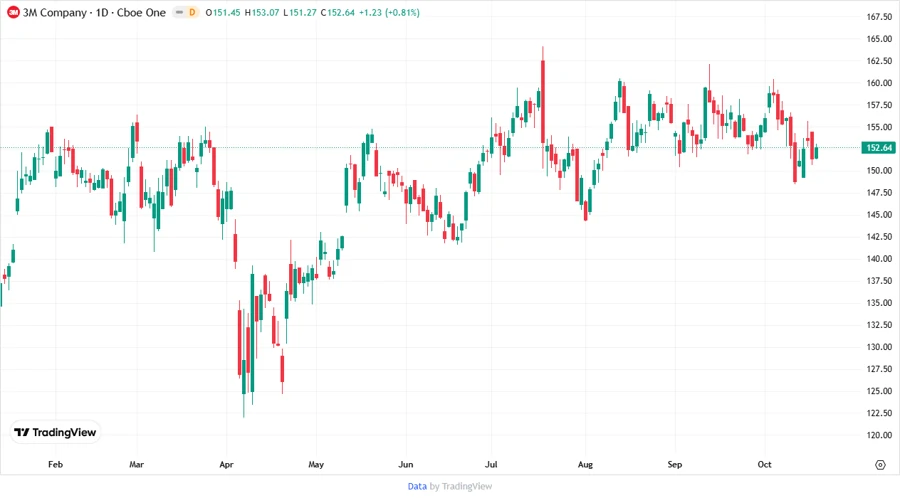
Price Development
Dividend Scoring System
| Category | Score | |
|---|---|---|
| Dividend yield | 4 | |
| Dividend Stability | 5 | |
| Dividend growth | 2 | |
| Payout ratio | 3 | |
| Financial stability | 3 | |
| Dividend continuity | 5 | |
| Cashflow Coverage | 2 | |
| Balance Sheet Quality | 3 |
Overall Score: 27 out of 40
Rating
In conclusion, 3M Company presents a mixed dividend profile, with its strengths lying in historical consistency and future prospects overshadowed by recent growth challenges. Nevertheless, 3M's robust history of maintaining dividends makes it a viable option for income-focused investors, though caution is advised due to cash flow and leverage indicators. Going forward, investors should monitor 3M's cash flow metrics to ensure sustainability.
Smart Data Insight
Master the Perfect Entry & Exit for this Stock
Don't leave your profits to chance. Historically, this stock follows specific seasonal patterns that institutional traders use to maximize returns.
- ✅ Identify the "Golden Buying Window"
- ✅ Avoid high-risk correction cycles
- ✅ Backtested data from the last 20+ years