June 09, 2025 a 07:31 am

MMM: Dividend Analysis - 3M Company
3M Company, recognized for its innovative solutions, boasts a robust dividend history spanning over five decades. This analysis delves into its dividend sustainability amidst current challenges, offering insights into its payout stability and potential forecast adjustments.
Overview
The industrial giant 3M operates in the Industrial Conglomerates sector. With a current dividend yield of 1.94%, the company maintains its reputation by continuously rewarding shareholders through consistent payouts.
| Factor | Details |
|---|---|
| Sector | Industrial Conglomerates |
| Dividend Yield | 1.94% |
| Current Dividend per Share | 3.60 USD |
| Dividend History | 56 years |
| Last Cut or Suspension | None |
Dividend History
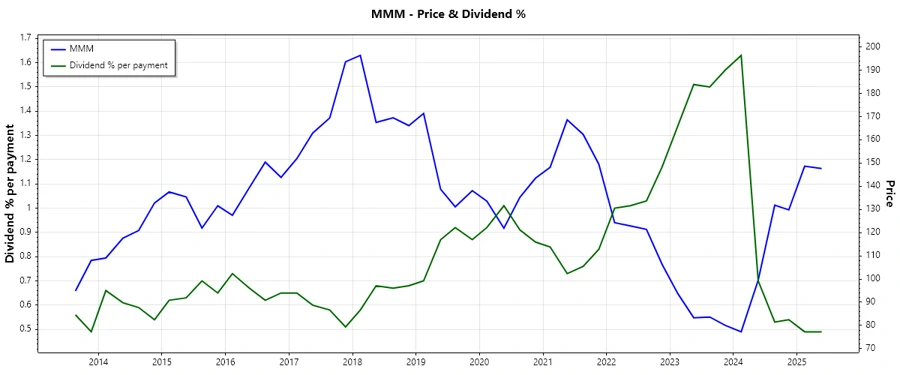
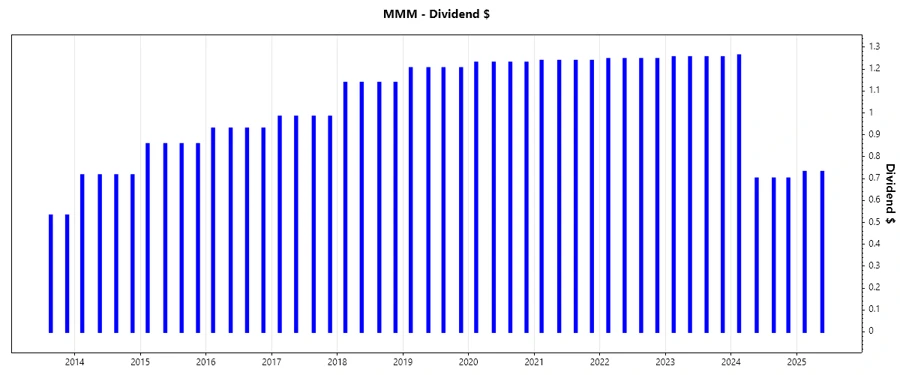
3M's illustrious dividend history reinforces its commitment to shareholders. Reviewing past payments provides insights into potential future payout continuity, crucial for long-term investors.
| Year | Dividend Per Share (USD) |
|---|---|
| 2025 | 1.46 |
| 2024 | 3.36 |
| 2023 | 5.02 |
| 2022 | 4.98 |
| 2021 | 4.95 |
Dividend Growth
Tracking dividend growth provides insights into a company's strategic financial decisions. 3M's recent performance indicates challenges, necessitating scrutiny of its growth strategies moving forward.
| Time | Growth |
|---|---|
| 3 years | -0.12% |
| 5 years | -0.07% |
The average dividend growth is -0.07% over 5 years. This shows a negative trend in dividend growth, reflecting potential financial recalibrations.
Payout Ratio
The payout ratio is a critical indicator of a company's ability to sustain dividends. High ratios may signal financial strain, while lower ratios imply sustainability.
| Key Figure | Ratio |
|---|---|
| EPS-based | 44.87% |
| Free cash flow-based | -2806.65% |
With an EPS-based payout ratio of 44.87%, 3M manages its dividends prudently. However, the alarming FCF-based ratio warrants close monitoring.
Cashflow & Capital Efficiency
Free cash flow yield and capital efficiency indicators reveal how effectively 3M generates and utilizes cash, directly impacting dividend sustainability.
| Year | Free Cash Flow Yield | Earnings Yield | CAPEX to Operating Cash Flow | Stock-based Compensation to Revenue | Free Cash Flow / Operating Cash Flow Ratio | ROIC |
|---|---|---|---|---|---|---|
| 2024 | 0.90% | 5.87% | 64.93% | 1.18% | 35.07% | 13.09% |
| 2023 | 10.00% | -13.82% | 24.18% | 0.83% | 75.82% | -17.14% |
| 2022 | 6.77% | 10.18% | 31.28% | 0.77% | 68.72% | 15.11% |
3M's fluctuating free cash flow yield indicates variable cash flow generation, with capital efficiency metrics suggesting room for operational improvement.
Balance Sheet & Leverage Analysis
Analyzing leverage metrics and liquidity ratios provides critical insights into 3M's financial stability and capacity to uphold its debt commitments.
| Year | Debt-to-Equity | Debt-to-Assets | Debt-to-Capital | Net Debt to EBITDA | Current Ratio | Quick Ratio | Financial Leverage |
|---|---|---|---|---|---|---|---|
| 2024 | 3.55 | 0.34 | 0.78 | 1.67 | N/A | 1.08 | 10.38 |
| 2023 | 3.51 | 0.33 | 0.78 | -1.62 | 1.07 | 0.76 | 10.52 |
| 2022 | 1.10 | 0.35 | 0.52 | 1.44 | 1.54 | 0.98 | 3.15 |
3M's high financial leverage and varied debt-to-equity ratios exemplify exposure to debt, necessitating strategic adjustments for enhanced fiscal health.
Fundamental Strength & Profitability
Metrics such as ROE and profitability margins highlight 3M's operational efficiency and market competitiveness, critical for sustainable growth.
| Year | Return on Equity | Return on Assets | Net Margin | EBIT Margin | EBITDA Margin | Gross Margin | R&D to Revenue |
|---|---|---|---|---|---|---|---|
| 2024 | 108.62% | 10.47% | 16.98% | 19.61% | 19.62% | 41.21% | 4.42% |
| 2023 | -145.52% | -13.83% | -21.40% | -26.76% | -20.65% | 43.46% | 5.64% |
| 2022 | 39.11% | 12.44% | 16.88% | 20.02% | 25.48% | 43.81% | 5.44% |
While 3M exhibits strong historical ROE, recent negative margins suggest operational setbacks, urging concentrated efforts on efficiency and innovation.
Dividend Scoring System
| Criterion | Score | |
|---|---|---|
| Dividend yield | 3 | |
| Dividend Stability | 4 | |
| Dividend growth | 2 | |
| Payout ratio | 2 | |
| Financial stability | 2 | |
| Dividend continuity | 5 | |
| Cashflow Coverage | 2 | |
| Balance Sheet Quality | 2 |
Total Score: 22/40
Rating
3M Company earns a fair dividend rating amidst its historical commitment to shareholder returns. However, recent challenges necessitate vigilance, with recommendations focused on monitoring financial recovery and dividend strategies.
Smart Data Insight
Master the Perfect Entry & Exit for this Stock
Don't leave your profits to chance. Historically, this stock follows specific seasonal patterns that institutional traders use to maximize returns.
- ✅ Identify the "Golden Buying Window"
- ✅ Avoid high-risk correction cycles
- ✅ Backtested data from the last 20+ years