September 08, 2025 a 08:15 am
MMC: Trend and Support & Resistance Analysis - Marsh & McLennan Companies, Inc.
Marsh & McLennan Companies, Inc. has shown mixed performance over the past few months, balancing between potential growth and market pressures. The recent trend indicates a shifting momentum that could present both opportunities and challenges for investors. This analysis provides key insights into the trend dynamics and crucial support and resistance levels.
Trend Analysis
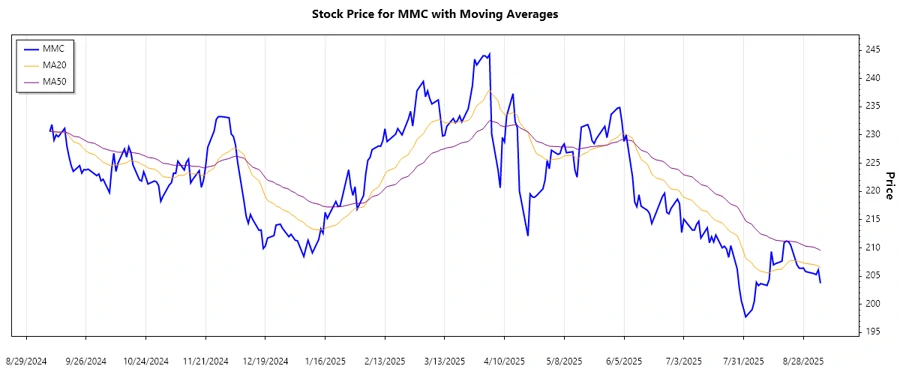
The recent data suggests a downward trend in the stock price for Marsh & McLennan Companies, Inc. By calculating the EMA20 and EMA50, we observe that the EMA20 is below the EMA50, confirming a ▼ downtrend. The following table summarizes the trend over the last seven days:
| Date | Close Price | Trend |
|---|---|---|
| 2025-09-05 | 203.74 | ▼ |
| 2025-09-04 | 206.11 | ▼ |
| 2025-09-03 | 205.27 | ▼ |
| 2025-09-02 | 205.44 | ▼ |
| 2025-08-29 | 205.81 | ▲ |
| 2025-08-28 | 206.44 | ▲ |
| 2025-08-27 | 206.37 | ▼ |
Overall, the technical indicators suggest the potential persistence of this downward trend unless a decisive upward breakout occurs.
Support- and Resistance
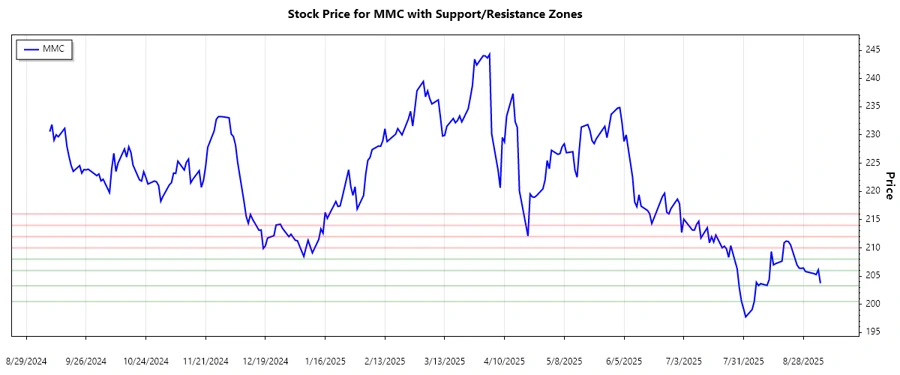
A detailed analysis reveals critical support and resistance zones. These levels can act as price barriers and influence future stock movements.
| Zone Type | From | To |
|---|---|---|
| Support Zone 1 | 200.50 | 203.30 |
| Support Zone 2 | 206.00 | 208.00 |
| Resistance Zone 1 | 210.00 | 212.00 |
| Resistance Zone 2 | 214.00 | 216.00 |
The current stock price finds itself near the lower end of the support zone at 203.74, indicating a strong area for potential price stabilization.
Conclusion
In conclusion, Marsh & McLennan Companies, Inc. reflects a short-term bearish outlook due to the recent downtrend. However, with strong support levels, there remains a possibility for a price rebound or consolidation moving forward. Investors should closely monitor how the stock interacts with the identified support and resistance levels, which may provide actionable signals for future trading decisions. The risks include further depreciation if support levels break, whereas opportunities for gains lie in potential trend reversals or sustained support zones.
Smart Data Insight
Master the Perfect Entry & Exit for this Stock
Don't leave your profits to chance. Historically, this stock follows specific seasonal patterns that institutional traders use to maximize returns.
- ✅ Identify the "Golden Buying Window"
- ✅ Avoid high-risk correction cycles
- ✅ Backtested data from the last 20+ years