November 19, 2025 a 11:31 am

MMC: Dividend Analysis - Marsh & McLennan Companies, Inc.
Marsh & McLennan Companies, Inc. exhibits a resilient dividend profile, with over four decades of dividend history. Its stable sector position coupled with healthy payout ratios makes it a promising option for dividend investors. With a 5-year average dividend growth of 11.88%, the company demonstrates a commitment to rewarding its shareholders. However, recent market conditions should be monitored for their impact on the firm's financial leverage and cash flow stability.
📊 Overview
Marsh & McLennan Companies operates in the professional services sector, offering services like risk management and consulting.
| Sector | Dividend Yield | Current Dividend per Share | Dividend History | Last Cut/Suspension |
|---|---|---|---|---|
| Professional Services | 1.72% | $3.08 | 43 years | 2005 |
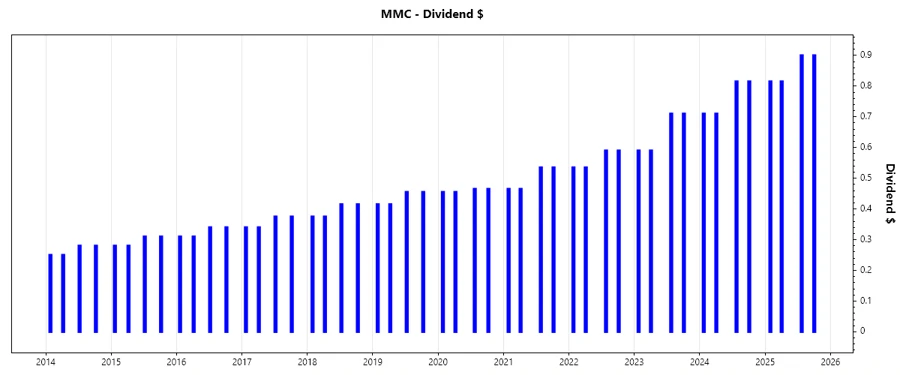
🗣️ Dividend History
With a strong dividend history of 43 consecutive years, Marsh & McLennan's commitment to share returns is evident. This stability is a crucial indicator for long-term investors seeking reliable income streams.
| Year | Dividend per Share (USD) |
|---|---|
| 2025 | $3.43 |
| 2024 | $3.05 |
| 2023 | $2.60 |
| 2022 | $2.25 |
| 2021 | $2.00 |
📈 Dividend Growth
The company has experienced steady dividend growth over the years, demonstrating its capacity for continuous shareholder value creation.
| Time | Growth |
|---|---|
| 3 years | 15.10% |
| 5 years | 11.88% |
The average dividend growth is 11.88% over 5 years. This shows moderate but steady dividend growth, highlighting commitment to shareholder returns.
💰 Payout Ratio
Payout ratios are essential in assessing a company's financial health regarding its dividend obligations.
| Key Figure | Ratio |
|---|---|
| EPS-based | 36.59% |
| Free cash flow-based | 29.59% |
The payout ratio of 36.59% (EPS) and 29.59% (FCF) indicates a sustainable dividend covered by profits and cash flow.
🏦 Cashflow & Capital Efficiency
An efficient allocation of capital and robust cash flows are critical for supporting dividends and growth investments.
| Metric | 2024 | 2023 | 2022 |
|---|---|---|---|
| Free Cash Flow Yield | 3.81% | 4.10% | 3.63% |
| Earnings Yield | 3.88% | 4.01% | 3.69% |
| CAPEX to Operating Cash Flow | 7.35% | 9.77% | 13.56% |
| Stock-based Compensation to Revenue | 1.50% | 1.60% | 1.77% |
| Free Cash Flow / Operating Cash Flow Ratio | 92.65% | 90.23% | 86.44% |
Cash flow metrics indicate a stable flow of cash supporting efficient capital allocation policies. While capital expenditure is controlled, free cash flow generation is steady and strong.
📉 Balance Sheet & Leverage Analysis
Leverage ratios and balance sheet metrics help assess financial risk and the capacity for dividend payments.
| Metric | 2024 | 2023 | 2022 |
|---|---|---|---|
| Debt-to-Equity | 1.64 | 1.27 | 1.28 |
| Debt-to-Assets | 38.71% | 32.14% | 40.27% |
| Debt-to-Capital | 62.10% | 55.87% | 56.15% |
| Net Debt to EBITDA | 2.81x | 1.91x | 2.28x |
| Current Ratio | - | 1.10 | 0.47 |
| Quick Ratio | 1.13 | 1.10 | 0.47 |
| Financial Leverage | 4.23x | 3.94x | 3.18x |
The company's balance sheet reveals a high debt-to-equity ratio, raising concerns about leverage and financial flexibility.
✅ Fundamental Strength & Profitability
Profitability ratios showcase the firm's capability to generate earnings relative to sales, assets, and equity.
| Metric | 2024 | 2023 | 2022 |
|---|---|---|---|
| Return on Equity | 30.43% | 30.81% | 28.99% |
| Return on Assets | 7.19% | 7.82% | 9.12% |
| Net Profit Margin | 16.60% | 16.52% | 14.72% |
| EBIT Margin | 25.27% | 24.65% | 21.96% |
| EBITDA Margin | 28.32% | 27.78% | 25.43% |
| Gross Margin | 42.78% | 42.39% | 41.74% |
| R&D to Revenue | 0% | 0% | 0% |
High return on equity and steady margins suggest fundamental strength, with efficient resource management maintaining profitability.
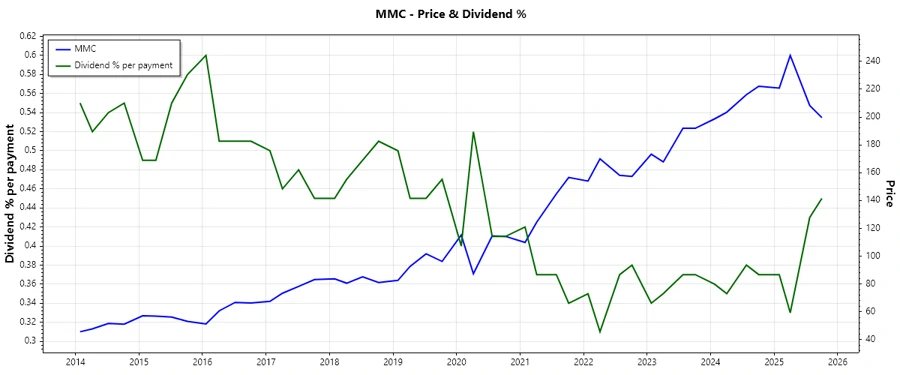
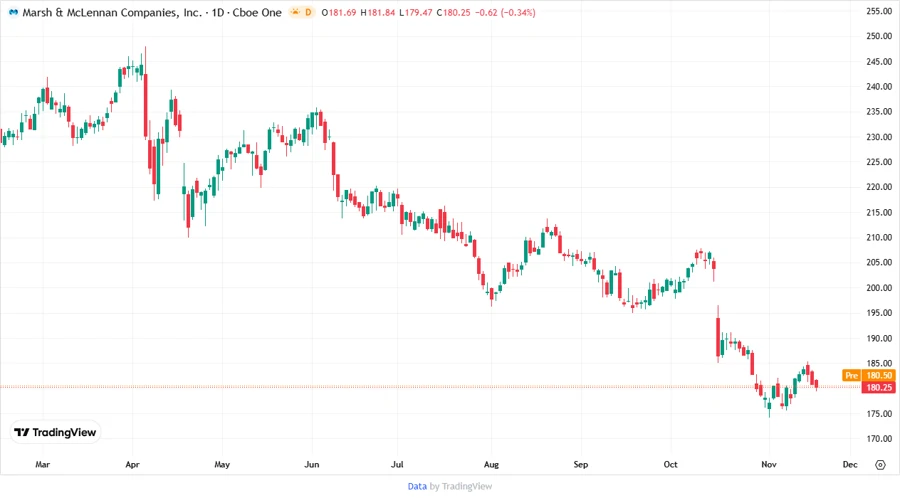
📈 Price Development
🗳️ Dividend Scoring System
| Category | Score (1-5) | Score Bar |
|---|---|---|
| Dividend Yield | 3 | |
| Dividend Stability | 5 | |
| Dividend Growth | 4 | |
| Payout Ratio | 4 | |
| Financial Stability | 3 | |
| Dividend Continuity | 5 | |
| Cashflow Coverage | 4 | |
| Balance Sheet Quality | 3 |
Total Score: 31/40
⭐ Rating
Marsh & McLennan Companies, Inc. presents a robust dividend profile with a strong history and moderate growth prospects. The firm's balance sheet highlights concerning leverage that warrants monitoring, though financial metrics generally suggest stability. For income-focused investors, the company's ability to maintain and potentially grow dividends combined with its solid market position forms a compelling investment case, meriting a favorable rating.
Smart Data Insight
Master the Perfect Entry & Exit for this Stock
Don't leave your profits to chance. Historically, this stock follows specific seasonal patterns that institutional traders use to maximize returns.
- ✅ Identify the "Golden Buying Window"
- ✅ Avoid high-risk correction cycles
- ✅ Backtested data from the last 20+ years