October 27, 2025 a 03:31 am


MMC: Dividend Analysis - Marsh & McLennan Companies, Inc.
Marsh & McLennan Companies, Inc. (MMC) exhibits a solid dividend profile characterized by a reliable history and consistent payouts. Given its robust market capitalization and strong financial health, MMC maintains an attractive dividend yield, albeit modest. Investors seeking stability and a seasoned dividend history might find this stock appealing. The recent dividend growth suggests commitment to enhancing shareholder value, despite not having the most aggressive growth rates.
📊 Overview
Marsh & McLennan operates predominantly in the Financial sector and currently offers a dividend yield of 1.72%. This yield, while not the highest, is supported by a current dividend of USD 3.08 per share, showcasing reliability in shareholder returns. The company's historical dividend stability is indicated by 43 consecutive years of payouts, with the last cut occurring in 2005.
| Metric | Value |
|---|---|
| Sector | Financial |
| Dividend Yield | 1.72% |
| Current Dividend Per Share | 3.08 USD |
| Dividend History | 43 years |
| Last Cut or Suspension | 2005 |
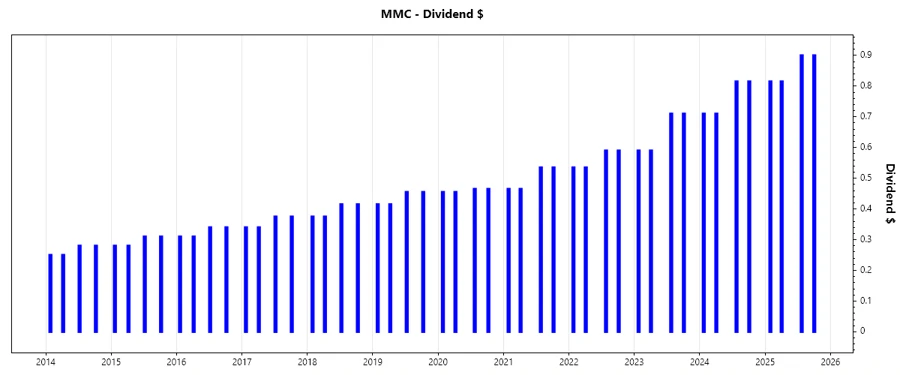
📈 Dividend History
Marsh & McLennan's dividend history demonstrates long-term commitment to returning capital to shareholders, crucial for evaluating potential consistent income. The company's ability to sustain dividends over multiple decades underpins its financial resilience and shareholder focus.
| Year | Dividend Per Share (USD) |
|---|---|
| 2025 | 3.43 |
| 2024 | 3.05 |
| 2023 | 2.60 |
| 2022 | 2.25 |
| 2021 | 2.00 |
📉 Dividend Growth
The growth rate of dividends over both three and five years is 15.10% and 11.88%, respectively, showing moderate but consistent increases. For investors, this represents an opportunity for income growth that might outpace inflation, justifying MMC's inclusion in a long-term focused portfolio.
| Time | Growth |
|---|---|
| 3 years | 15.10% |
| 5 years | 11.88% |
The average dividend growth is 11.88% over 5 years, demonstrating moderate but steady dividend growth.
✅ Payout Ratio
Payout ratios reveal how a company's earnings and cash flows are used to pay dividends, indicating the sustainability of dividends. MMC's payout ratio based on EPS is 36.59%, and FCF-based is 54.31%. These figures suggest a conservative approach in balancing dividend payments with retained earnings.
| Key Figure | Ratio |
|---|---|
| EPS-based | 36.59% |
| Free Cash Flow-based | 54.31% |
The payout ratios suggest that MMC wisely balances payouts with financial health, ensuring rates are manageable and sustainable long-term.
Cashflow & Capital Efficiency
Analyzing cash flow metrics helps assess a firm's capacity to cover dividends and evaluate capital efficiency. Such evaluations contribute to understanding whether the firm can maintain or improve its dividend payments, given cash flow reliability and capital investment efficiency.
| Metric | 2024 | 2023 | 2022 |
|---|---|---|---|
| Free Cash Flow Yield | 3.81% | 4.10% | 3.63% |
| Earnings Yield | 3.89% | 4.01% | 3.69% |
| CAPEX to Operating Cash Flow | 7.35% | 9.77% | 13.56% |
| Stock-based Compensation to Revenue | 1.50% | 1.60% | 1.77% |
| Free Cash Flow / Operating Cash Flow Ratio | 92.65% | 90.23% | 86.44% |
Marsh & McLennan demonstrates strong cash flow generation capabilities and capital efficiency, supporting dividend sustainability. Reduced investments in CAPEX reflect optimization, affirming a dividend-friendly stance.
Balance Sheet & Leverage Analysis
Balance sheet and leverage metrics are crucial for understanding financial health, particularly concerning debt management and liquidity. Lower leverage indicates higher financial flexibility, crucial in economic downturns.
| Metric | 2024 | 2023 | 2022 |
|---|---|---|---|
| Debt to Equity | 1.64 | 1.27 | 1.28 |
| Debt to Assets | 38.71% | 32.14% | 40.27% |
| Debt to Capital | 62.10% | 55.87% | 56.15% |
| Net Debt to EBITDA | 2.81 | 1.91 | 2.28 |
| Current Ratio | 1.13 | 1.10 | 0.47 |
| Quick Ratio | 1.13 | 1.10 | 0.47 |
| Financial Leverage | 4.23 | 3.94 | 3.18 |
Despite high financial leverage, Marsh & McLennan maintains adequate liquidity ratios, suggesting prudent financial management and robust asset utility, mitigating risks associated with debt.
Fundamental Strength & Profitability
Profitability metrics, such as margins and return on equity (ROE), are indicators of operational efficiency and management effectiveness. High margins translate to robust earnings potential, strengthening the dividend argument.
| Metric | 2024 | 2023 | 2022 |
|---|---|---|---|
| Return on Equity | 30.43% | 30.81% | 28.99% |
| Return on Assets | 7.19% | 7.82% | 9.12% |
| Net Margin | 16.60% | 16.52% | 14.72% |
| EBIT Margin | 25.27% | 24.65% | 21.96% |
| EBITDA Margin | 28.32% | 27.78% | 25.43% |
| Gross Margin | 42.77% | 42.39% | 41.74% |
| R&D to Revenue | 0.00% | 0.00% | 0.00% |
Marsh & McLennan's profitability remains strong, as evidenced by consistent ROE and healthy margins. This reliability in earnings supports robust dividend maintenance and potential growth.
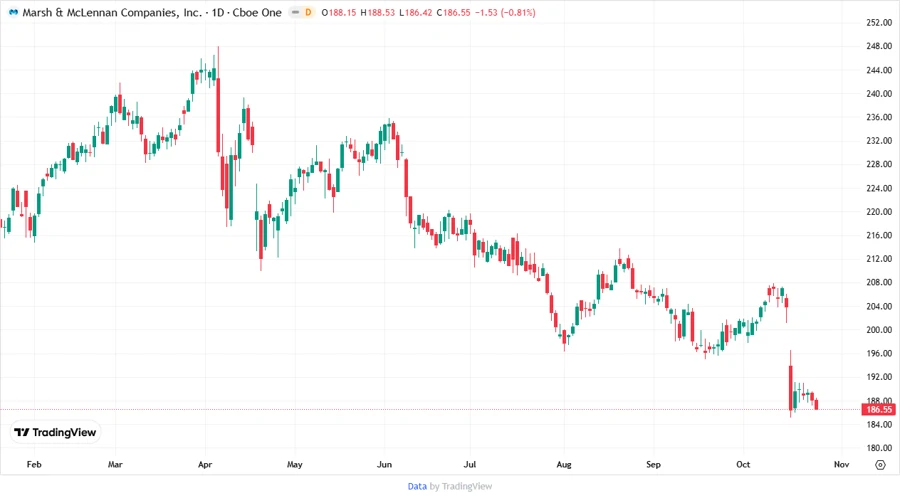
Price Development
Dividend Scoring System
| Category | Score | |
|---|---|---|
| Dividend Yield | 3 | |
| Dividend Stability | 5 | |
| Dividend Growth | 4 | |
| Payout Ratio | 4 | |
| Financial Stability | 4 | |
| Dividend Continuity | 5 | |
| Cashflow Coverage | 4 | |
| Balance Sheet Quality | 3 |
Overall Score: 32/40
Rating
In summary, Marsh & McLennan Companies, Inc. is well-positioned to offer steady and growing dividends supported by its solid financial foundations. While the dividend yield is not especially high, the company’s track record of stability and prudent growth strategies make it a commendable choice for conservative, income-focused portfolios. Investors may consider it a "hold" for the unique blend of stability and modest growth opportunities it provides.
Smart Data Insight
Master the Perfect Entry & Exit for this Stock
Don't leave your profits to chance. Historically, this stock follows specific seasonal patterns that institutional traders use to maximize returns.
- ✅ Identify the "Golden Buying Window"
- ✅ Avoid high-risk correction cycles
- ✅ Backtested data from the last 20+ years