
July 13, 2026 a 07:31 am
MLM: Dividend Analysis - Martin Marietta Materials, Inc.
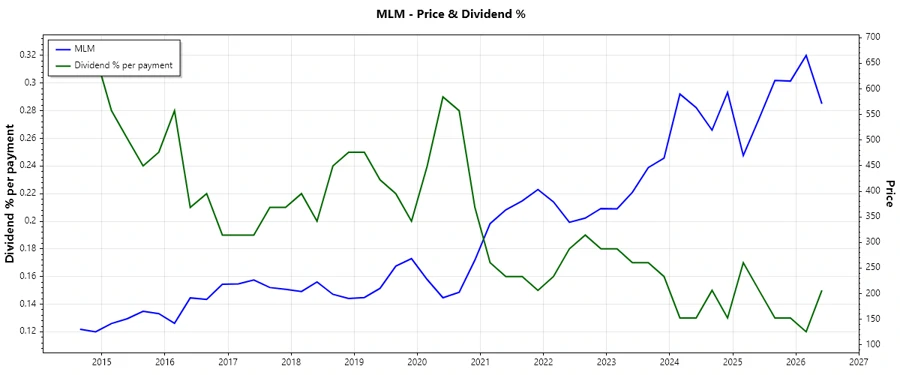
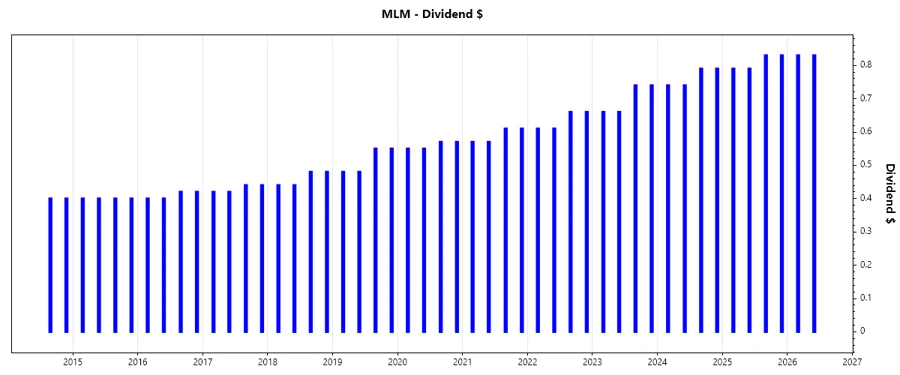
Martin Marietta Materials, Inc. has demonstrated a consistent ability to reward shareholders through dividends with a history spanning over three decades. While the current dividend yield of just over half a percent might seem modest, the company's reliable payment history and gradual growth in dividends per share showcase its commitment to rewarding investors. The lack of any recent dividend cuts further highlights the stability of its distributions.
📊 Overview
The following table provides a quick overview of Martin Marietta Materials' dividend profile and sector positioning:
| Key Metrics | Data |
|---|---|
| Sector | Materials |
| Dividend Yield | 0.58% |
| Current Dividend Per Share | 3.27 USD |
| Dividend History | 33 years |
| Last Cut or Suspension | None |
🗣️ Dividend History
Understanding the past dividend payments helps gauge the reliability and steady growth of a company's shareholder returns. Martin Marietta's uninterrupted dividend history is a significant indicator of its financial health.
| Year | Dividend Per Share (USD) |
|---|---|
| 2026 | 1.66 |
| 2025 | 3.24 |
| 2024 | 3.06 |
| 2023 | 2.80 |
| 2022 | 2.54 |
📈 Dividend Growth
The way dividends grow over the years is crucial for investors seeking increasing returns. Consistent growth indicates the company's confidence in its future earnings.
| Time | Growth |
|---|---|
| 3 years | 8.45% |
| 5 years | 7.66% |
The average dividend growth is 7.66% over 5 years. This shows moderate but steady dividend growth.
📉 Payout Ratio
Payout ratios help gauge how sustainable the dividend payments are relative to earnings and cash flows.
| Key figure | Ratio |
|---|---|
| EPS-based | 7.77% |
| Free Cash Flow-based | 18.97% |
The payout ratios are conservative, indicating that dividends are well-covered by both earnings and free cash flow. An EPS payout ratio of 7.77% and FCF payout ratio of 18.97% suggest strong dividend sustainability.
✅ Cashflow & Capital Efficiency
Evaluating cash flow and capital efficiency provides insight into the company's operational performance and reinvestment capabilities.
| Metric | 2023 | 2024 | 2025 |
|---|---|---|---|
| Free Cash Flow Yield | 2.84% | 1.90% | 2.60% |
| Earnings Yield | 3.79% | 6.29% | 3.03% |
| CAPEX to Operating Cash Flow | 42.54% | 58.60% | 45.21% |
| Stock-based Compensation to Revenue | 0.74% | 0.89% | 0.70% |
| Free Cash Flow / Operating Cash Flow Ratio | 57.46% | 41.40% | 54.79% |
Martin Marietta exhibits a strong cash flow conversion rate, with stable free cash flow yields and efficient use of capital expenditures, reinforcing its capital efficiency strategy.
⚠️ Balance Sheet & Leverage Analysis
Leverage analysis is crucial to understanding the risk of the company's debt situation and its sustainability.
| Metric | 2023 | 2024 | 2025 |
|---|---|---|---|
| Debt-to-Equity | 0.59 | 0.61 | 0.53 |
| Debt-to-Assets | 31.25% | 31.94% | 28.45% |
| Debt-to-Capital | 37.04% | 38.04% | 34.67% |
| Net Debt to EBITDA | 1.59 | 1.54 | 2.44 |
| Current Ratio | 3.35 | 2.50 | 3.57 |
| Quick Ratio | 2.50 | 1.40 | 2.36 |
| Financial Leverage | 1.88 | 1.92 | 1.87 |
Leverage ratios are within acceptable limits, indicating sound debt management and financial stability, ensuring resilience against economic downturns.
📊 Fundamental Strength & Profitability
Evaluating profitability metrics underscores the efficiency with which a company utilizes its resources to generate profit.
| Metric | 2023 | 2024 | 2025 |
|---|---|---|---|
| Return on Equity | 14.55% | 21.10% | 11.33% |
| Return on Assets | 7.73% | 10.98% | 6.08% |
| Net Margin | 17.25% | 30.52% | 17.37% |
| EBIT Margin | 24.47% | 42.30% | 23.18% |
| EBITDA Margin | 32.03% | 51.07% | 32.92% |
| Gross Margin | 29.85% | 28.73% | 29.98% |
| Research & Development to Revenue | 0% | 0% | 0% |
Profit margins are robust, reflecting effective cost management and operational efficiency. The strong return metrics highlight Martin Marietta's ability to generate substantial profits from its equity and assets.
📈 Price Development
🔍 Dividend Scoring System
| Criterion | Score (/5) | Bar |
|---|---|---|
| Dividend Yield | 2 | |
| Dividend Stability | 5 | |
| Dividend Growth | 4 | |
| Payout Ratio | 5 | |
| Financial Stability | 4 | |
| Dividend Continuity | 5 | |
| Cashflow Coverage | 4 | |
| Balance Sheet Quality | 4 |
Total Score: 33/40
🔍 Rating
Martin Marietta Materials, Inc. presents a resilient dividend profile characterized by exceptional dividend stability and strong payout ratios. The moderate growth and robust financial metrics make it a solid choice for income-focused investors seeking stability and moderate growth. Its consistent dividend payments and sound financial management warrant a positive outlook. However, given the relatively low yield, potential investors should consider balance with other high-yield options to achieve optimal growth in income portfolios.
Smart Data Insight
Master the Perfect Entry & Exit for this Stock
Don't leave your profits to chance. Historically, this stock follows specific seasonal patterns that institutional traders use to maximize returns.
- ✅ Identify the "Golden Buying Window"
- ✅ Avoid high-risk correction cycles
- ✅ Backtested data from the last 20+ years