March 16, 2026 a 07:31 am


MLM: Dividend Analysis - Martin Marietta Materials, Inc.
Martin Marietta Materials, Inc. presents a strong dividend profile with a consistent history of payments over the last three decades. The company demonstrates commitment to shareholder value through progressive dividend growth despite a relatively low dividend yield. These characteristics make MLM a potentially attractive addition to dividend-focused portfolios, especially for investors prioritizing stability and incremental income growth.
📊 Overview
Evaluating key financial ratios provides initial insights into a company's dividend sustainability and attractiveness. Martin Marietta Materials, Inc. has shown a sound ability to distribute profits to shareholders consistently over 33 years, a testament to its operational stability.
| Metric | Value |
|---|---|
| Sector | Building Materials |
| Dividend Yield | 0.49% |
| Current Dividend per Share | 3.27 USD |
| Dividend History | 33 years |
| Last Cut or Suspension | None |
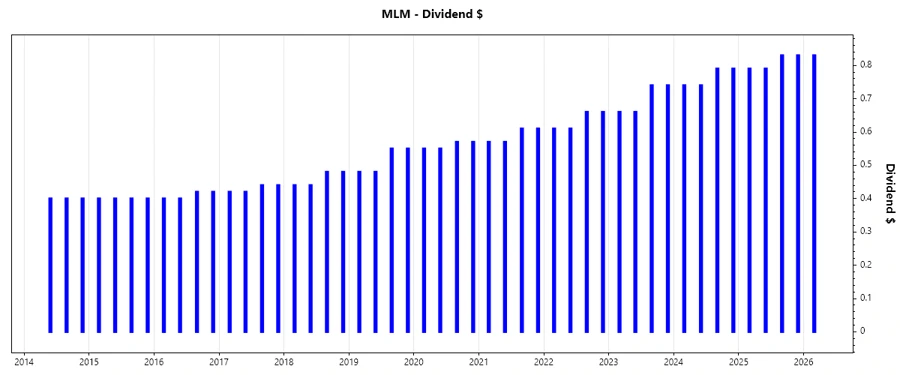
🗣️ Dividend History
Historical dividend analysis is crucial for understanding the consistency and reliability of distributions. MLM has increased its dividend over time, reflecting stable financial health and a commitment to returning value to shareholders.
| Year | Dividend per Share (USD) |
|---|---|
| 2026 | 0.83 |
| 2025 | 3.24 |
| 2024 | 3.06 |
| 2023 | 2.80 |
| 2022 | 2.54 |
📈 Dividend Growth
Examining dividend growth rates is essential for evaluating potential future income streams from an investment. MLM's demonstrating a 7.66% growth over 5 years signifies a trend of moderate, reliable uplift in payouts.
| Time | Growth |
|---|---|
| 3 years | 8.45% |
| 5 years | 7.66% |
The average dividend growth is 7.66% over 5 years. This shows moderate but steady dividend growth.
📉 Payout Ratio
Understanding payout ratios is pivotal for gauging the sustainability of dividend payments. MLM maintains healthy payout ratios, with EPS Payout at 17.33% and Free Cash Flow Payout at 20.15%.
| Key figure ratio | Value |
|---|---|
| EPS-based | 17.33% |
| Free cash flow-based | 20.15% |
The conservative payout ratios highlight the company's disciplined approach to balancing shareholder returns and reinvestment for growth.
💵 Cashflow & Capital Efficiency
Assessing cashflow metrics lets us understand the company's operational efficiency and its ability to generate free cash flow:
| Year | 2023 | 2024 | 2025 |
|---|---|---|---|
| Free Cash Flow Yield | 2.84% | 1.90% | 2.60% |
| Earnings Yield | 3.79% | 6.29% | 3.03% |
| CAPEX to Operating Cash Flow | 42.54% | 58.60% | 45.21% |
| Stock-based Compensation to Revenue | 0.74% | 0.89% | 0.71% |
| Free Cash Flow / Operating Cash Flow Ratio | 57.46% | 41.40% | 54.79% |
The data reflects strong free cash flow generation and balanced capital expenditure implying prudent capital resource management.
🏦 Balance Sheet & Leverage Analysis
Analyzing balance sheet ratios helps in understanding financial health and leverage levels. Below is a summary for MLM:
| Year | 2023 | 2024 | 2025 |
|---|---|---|---|
| Debt-to-Equity | 0.588 | 0.614 | 0.530 |
| Debt-to-Assets | 0.312 | 0.319 | 0.284 |
| Debt-to-Capital | 0.370 | 0.380 | 0.347 |
| Net Debt to EBITDA | 1.591 | 1.538 | 2.440 |
| Current Ratio | 3.35 | 2.50 | 3.57 |
| Quick Ratio | 2.50 | 1.40 | 2.36 |
| Financial Leverage | 1.883 | 1.922 | 1.865 |
The ratios indicate a healthy balance sheet with moderate leverage, ensuring long-term financial stability.
📈 Fundamental Strength & Profitability
Profitability metrics evaluate the firm's operational success and its ability to turn revenues into profits efficiently:
| Year | 2023 | 2024 | 2025 |
|---|---|---|---|
| Return on Equity | 14.55% | 21.10% | 11.33% |
| Return on Assets | 7.73% | 10.98% | 6.08% |
| Margins: Net | 17.25% | 30.52% | 17.37% |
| EBIT | 24.47% | 42.30% | 23.18% |
| EBITDA | 32.03% | 51.07% | 32.92% |
| Gross | 29.85% | 28.73% | 29.98% |
| Research & Development to Revenue | 0% | 0% | 0% |
The strong ROE and profit margins reflect effective management and operational efficiency.
💹 Price Development
✅ Dividend Scoring System
| Criteria | Score | |
|---|---|---|
| Dividend Yield | 2 | |
| Dividend Stability | 5 | |
| Dividend Growth | 4 | |
| Payout Ratio | 5 | |
| Financial Stability | 4 | |
| Dividend Continuity | 5 | |
| Cashflow Coverage | 4 | |
| Balance Sheet Quality | 4 |
Total Score: 33/40
🗣️ Rating
Overall, Martin Marietta Materials, Inc. provides a robust dividend profile characterized by stability and sustainable growth. Despite a modest yield, its strong financial health, prudent payout ratios, and reliable dividend continuity render it a compelling choice for investors seeking steady income with growth potential.
Smart Data Insight
Master the Perfect Entry & Exit for this Stock
Don't leave your profits to chance. Historically, this stock follows specific seasonal patterns that institutional traders use to maximize returns.
- ✅ Identify the "Golden Buying Window"
- ✅ Avoid high-risk correction cycles
- ✅ Backtested data from the last 20+ years