August 14, 2025 a 03:31 pm

MLM: Dividend Analysis - Martin Marietta Materials, Inc.
Martin Marietta Materials, Inc. presents a stable dividend profile with consistent performance over 32 years of dividend payments. The company demonstrates strong financial metrics that ensure an attractive yet conservative payout policy.
📊 Overview
The analysis of Martin Marietta Materials, Inc. reveals a well-balanced dividend distribution marked by a sound yield amidst a robust sector performance.
| Key Metric | Value |
|---|---|
| Sector | Materials |
| Dividend yield | 0.58% |
| Current dividend per share | 3.08 USD |
| Dividend history | 32 years |
| Last cut or suspension | None |
🗣️ Dividend History
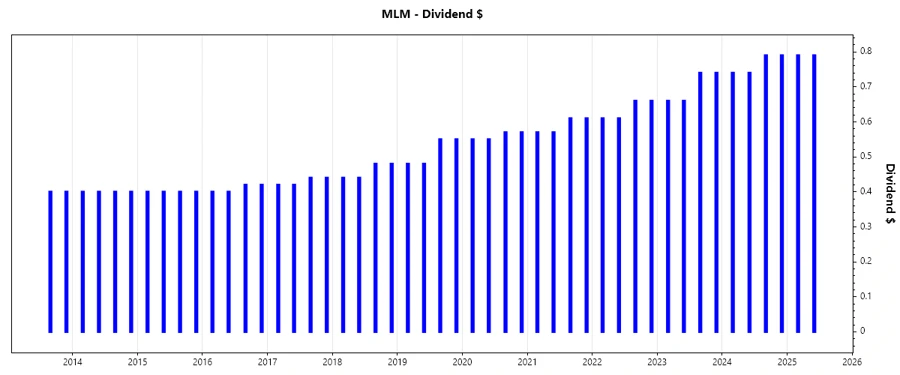
With a legacy of 32 years of uninterrupted dividend payments, Martin Marietta demonstrates a strong historical commitment to returning value to shareholders. Historical performance is essential for understanding future reliability and growth potential.
| Year | Dividend Per Share (USD) |
|---|---|
| 2025 | 1.58 |
| 2024 | 3.06 |
| 2023 | 2.80 |
| 2022 | 2.54 |
| 2021 | 2.36 |
📈 Dividend Growth
Analyzing the dividend growth for the last several years provides insights into the company's growth strategy and payout sustainability. Historical growth rates are crucial indicators for forecasting future trends and assessing ongoing shareholder return potential.
| Time | Growth |
|---|---|
| 3 years | 9.04% |
| 5 years | 8.24% |
The average dividend growth is 8.24% over 5 years. This shows moderate but steady dividend growth.
💸 Payout Ratio
A company’s payout ratio reflects how much of its profit is being returned to shareholders as dividends. Monitoring these ratios helps in understanding the sustainability of its dividend payments and potential future payout growth.
| Key figure ratio | Value |
|---|---|
| EPS-based | 16.94% |
| Free cash flow-based | 19.28% |
With an EPS payout ratio of 16.94% and a free cash flow payout ratio of 19.28%, the company maintains a conservative payout policy, supporting dividend longevity and potential growth.
💼 Cashflow & Capital Efficiency
Free cash flow generation and capital efficiency are central to a firm's ability to sustain and grow its dividends. Evaluating these figures offers a comprehensive view of the firm's operational health and capital allocation effectiveness.
| Year | 2024 | 2023 | 2022 |
|---|---|---|---|
| Free Cash Flow Yield | 1.90% | 2.84% | 2.42% |
| Earnings Yield | 6.29% | 3.78% | 4.11% |
| CAPEX to Operating Cash Flow | 58.60% | 42.55% | 48.61% |
| Stock-based Compensation to Revenue | 0.89% | 0.74% | 0.69% |
| Free Cash Flow / Operating Cash Flow Ratio | 41.40% | 57.45% | 51.39% |
The company's stable free cash flow and efficient capital use suggest robust operational health and the potential for sustained dividend growth.
📉 Balance Sheet & Leverage Analysis
A robust balance sheet and appropriate leverage ensure financial stability and liquidity, necessary for maintaining ongoing dividend disbursements and achieving retained earnings growth.
| Year | 2024 | 2023 | 2022 |
|---|---|---|---|
| Debt-to-Equity | 0.61 | 0.61 | 0.70 |
| Debt-to-Assets | 0.32 | 0.33 | 0.34 |
| Debt-to-Capital | 0.38 | 0.38 | 0.41 |
| Net Debt to EBITDA | 1.54 | 1.69 | 2.94 |
| Current Ratio | 2.50 | 3.35 | 1.99 |
| Quick Ratio | 1.40 | 2.50 | 1.39 |
| Financial Leverage | 1.92 | 1.88 | 2.09 |
Healthy leverage ratios confirm financial stability, indicating the company's capability to manage debt while preserving shareholder equity.
✅ Fundamental Strength & Profitability
Assessment of fundamental strength, including profitability matrices, directly aligns with shareholder value maximization strategy, reflecting return on investment for equity holders.
| Year | 2024 | 2023 | 2022 |
|---|---|---|---|
| Return on Equity | 21.10% | 14.55% | 12.08% |
| Return on Assets | 10.98% | 7.73% | 5.78% |
| Net Margin | 30.52% | 17.25% | 14.07% |
| EBIT Margin | 42.30% | 24.47% | 17.64% |
| EBITDA Margin | 51.01% | 31.95% | 25.85% |
| Gross Margin | 28.73% | 29.84% | 23.10% |
| R&D to Revenue | 0.00% | 0.00% | 0.00% |
High profitability ratios signal the strength of operational performance, underscoring Martin Marietta's competitive edge in yielding higher returns on capital employed.
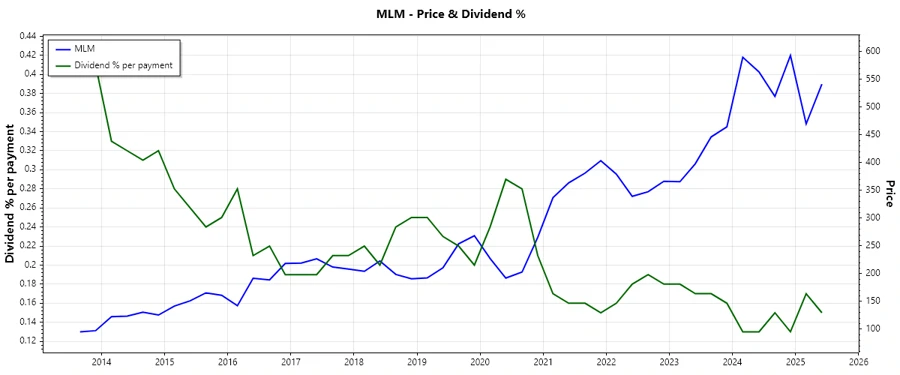
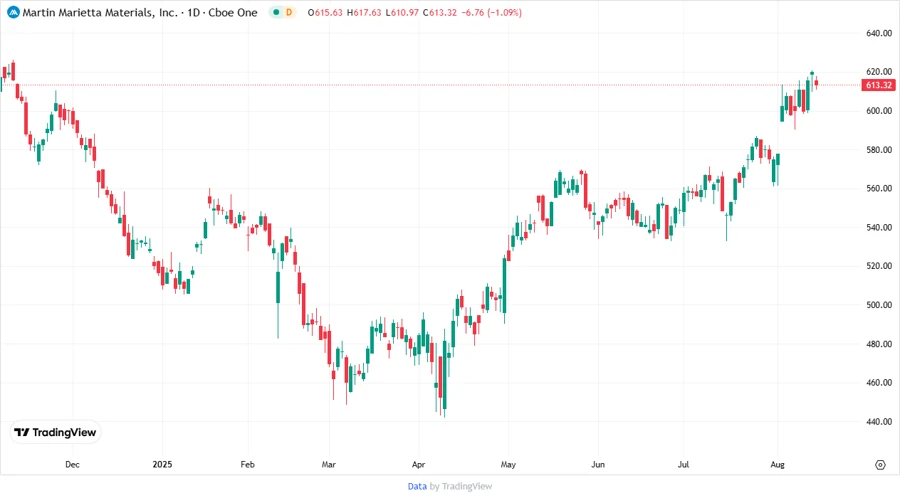
🔺 Price Development
🎯 Dividend Scoring System
| Criterion | Score | Rating |
|---|---|---|
| Dividend yield | 1 | |
| Dividend Stability | 5 | |
| Dividend growth | 4 | |
| Payout ratio | 5 | |
| Financial stability | 5 | |
| Dividend continuity | 5 | |
| Cashflow Coverage | 4 | |
| Balance Sheet Quality | 4 |
Total Score: 33/40
🌟 Rating
Martin Marietta Materials, Inc. maintains a robust dividend performance supported by sound financial structures and stable growth metrics. Despite a lower yield, their exemplary stability and responsible payout strategy make it a solid choice for conservative dividend investors.
Smart Data Insight
Master the Perfect Entry & Exit for this Stock
Don't leave your profits to chance. Historically, this stock follows specific seasonal patterns that institutional traders use to maximize returns.
- ✅ Identify the "Golden Buying Window"
- ✅ Avoid high-risk correction cycles
- ✅ Backtested data from the last 20+ years