August 12, 2025 a 03:15 am


MHK: Trend and Support & Resistance Analysis - Mohawk Industries, Inc.
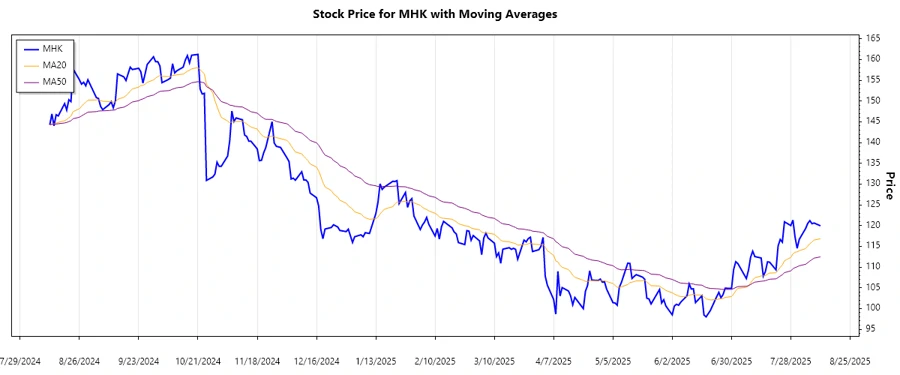
Mohawk Industries, Inc. (MHK) has shown some fluctuations in its price over the past months. Within the observed period, the stock appears to have a slight upward trend but faces current resistances due to economic conditions and market saturation in the flooring business. Potential investors should be cautious of the current levels, as they are approaching significant resistance zones, which could determine future price movements.
Trend Analysis
The analysis of Mohawk Industries (MHK) shows that the EMA20 is currently less than the EMA50, indicating a downward trend. This trend has been evident over the last few weeks as fluctuations in the flooring market and economic indicators continue to impact stock prices.
| Date | Close Price | Trend |
|---|---|---|
| 2025-08-11 | $119.94 | ▼ |
| 2025-08-08 | $120.61 | ▲ |
| 2025-08-07 | $120.45 | ▲ |
| 2025-08-06 | $121.18 | ▲ |
| 2025-08-05 | $120.53 | ▲ |
| 2025-08-04 | $119.29 | ▼ |
| 2025-08-01 | $116.68 | ▼ |
This downward pressure suggests cautious market behavior due to potential economic adjustments.
Support and Resistance
The analysis also indicates key support and resistance zones that are critical to monitor.
| Zone | From | To | Status |
|---|---|---|---|
| Support | $114.00 | $116.00 | ⚊ |
| Support | $110.00 | $112.00 | ⚊ |
| Resistance | $123.00 | $125.00 | ⚊ |
| Resistance | $128.00 | $130.00 | ⚊ |
Currently, the stock price nears the resistance zone between $123 and $125, indicating potential for a breakout or a pullback.
Conclusion
In conclusion, Mohawk Industries (MHK) is showing a short-term downward trend with calculated support and resistance zones that are pivotal in determining the stock's future trajectory. Investors should closely watch market indicators and economic conditions which might offer temporary setbacks or potential breakthroughs. While current conditions are challenging, savvy investors may find opportunities assailing near support zones for possible entries. Furthermore, breaking through a resistance level could signify new directions, while failing to catch support may indicate further declines.