November 26, 2025 a 04:45 pm

MHK: Fibonacci Analysis - Mohawk Industries, Inc.
Mohawk Industries, Inc. has shown a significant price movement over recent months. Analyzing the trend reveals key insights into potential future price actions. The company operates within a solid infrastructure, focusing on flooring products. Investors should consider both the fundamental business environment and technical indicators when evaluating MHK's stock potential. The latest data highlights crucial levels that could prove to be pivotal for future market directions.
Fibonacci Analysis
| Attribute | Details | ||||||||||||
|---|---|---|---|---|---|---|---|---|---|---|---|---|---|
| Trend Start Date | 2025-11-26 | ||||||||||||
| Trend End Date | 2025-10-21 | ||||||||||||
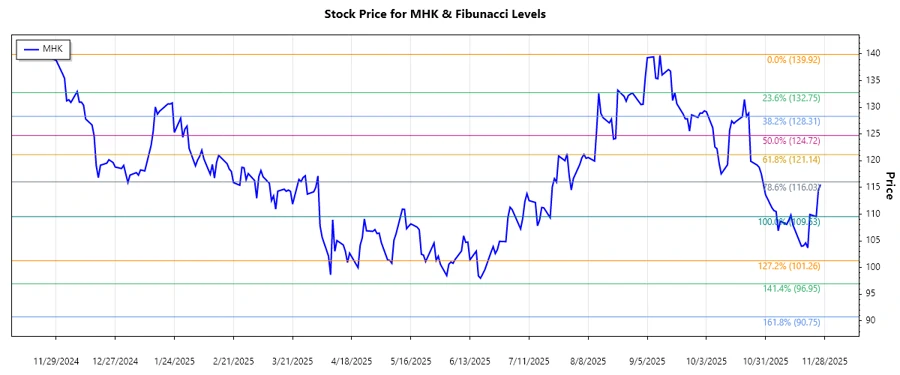
| High Point (Price/Date) | $139.92 / 2024-11-26 | ||||||||||||
| Low Point (Price/Date) | $109.53 / 2025-11-24 | ||||||||||||
| Fibonacci Levels |
|
||||||||||||
| Current Price Zone | 0.382: The stock is currently hovering around the 0.382 retracement zone. | ||||||||||||
| Technical Interpretation | A move above the 0.382 Fibonacci level may suggest strength, whereas resistance here may trigger a pullback. |
Conclusion
The MHK stock has experienced a downward trend from its high, positioning itself currently in a crucial retracement area. Investors should be vigilant as trading around these Fibonacci levels can indicate potential reversals or further downside. With the stock near the 0.382 level, a break past this point could suggest a potential price recovery, while failure to overcome it might signal further bearish momentum. For analysts, these technical levels are significant indicators that may lead to strategic decision-making. Carefully observing these dynamics alongside company performance metrics can offer robust investment insights.