May 02, 2026 a 01:15 pm
META: Trend and Support & Resistance Analysis - Meta Platforms, Inc.
The stock of Meta Platforms, Inc. (META) has shown notable fluctuations in recent months, reflecting its dynamic presence in the tech industry. Given its substantial investment in both Family of Apps and Reality Labs, META's performance in the market continues to capture the attention of analysts and investors alike. The stock's recent activity suggests a need to closely monitor its support and resistance levels for potential trading opportunities.
Trend Analysis
| Date | Closing Price (USD) | Trend |
|---|---|---|
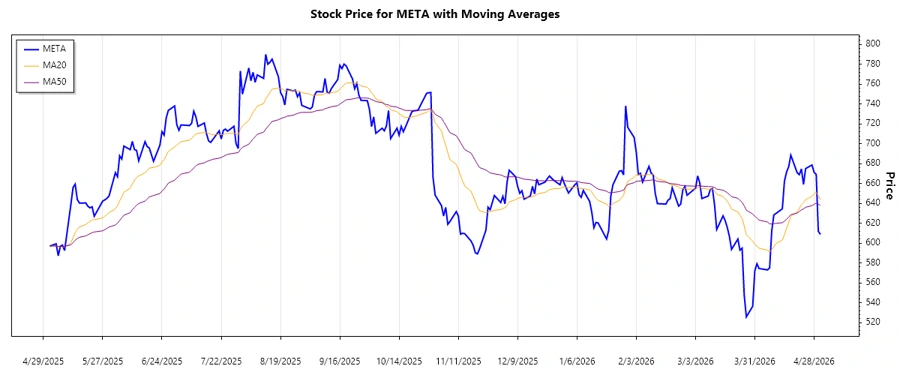
| 2026-05-01 | 608.75 | ⚖️ ▼ |
| 2026-04-30 | 611.91 | ⚖️ ▲ |
| 2026-04-29 | 669.12 | ⚖️ ▲ |
| 2026-04-28 | 671.34 | ⚖️ ▲ |
| 2026-04-27 | 678.62 | ▲ |
| 2026-04-24 | 675.03 | ▲ |
| 2026-04-23 | 659.15 | ▲ |
The short-term analysis indicates a volatile pattern with a preference towards a neutral to upward trend in the last week. The calculated EMAs suggest a potential continuation if conditions persist.
Support and Resistance
| Zone Type | Price Range (USD) |
|---|---|
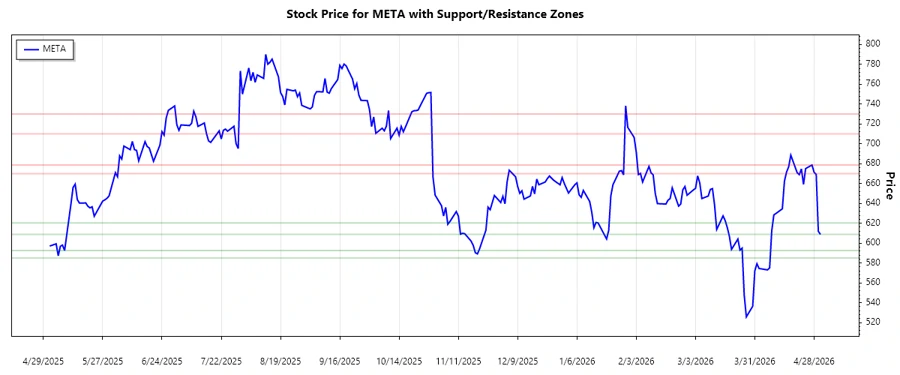
| Support | 608.75 - 620.25 |
| Support | 585.00 - 592.49 |
| Resistance | 670.00 - 678.62 |
| Resistance | 710.00 - 730.00 |
Currently, the price is oscillating in between the near support zone. Unless a significant breakout is achieved, this might indicate a stabilization phase before a decisive movement.
Conclusion
Meta Platforms, Inc. remains a focal point for investors due to its influential role in the tech landscape. The current patterns in support and resistance levels provide insight into potential trading opportunities, particularly if breaking out occurs. However, as the industry evolves, META must navigate both opportunities and uncertainties inherent in innovation-heavy sectors. Investors are advised to consider both short-term and long-term strategies, keeping an eye on market responses to Meta's business shifts and external economic factors. The stock's versatility, high beta, and dependence on consumer trends make it a critical watch in technology portfolios.
json Note: The above representations indicate the patterns found in the stock data for META with respect to both trend and support/resistance zones. Remember that financial markets are volatile and influenced by many factors, so always consider comprehensive advice before making investment decisions.
Smart Data Insight
Master the Perfect Entry & Exit for this Stock
Don't leave your profits to chance. Historically, this stock follows specific seasonal patterns that institutional traders use to maximize returns.
- ✅ Identify the "Golden Buying Window"
- ✅ Avoid high-risk correction cycles
- ✅ Backtested data from the last 20+ years