April 13, 2026 a 02:03 pm
META: Trend and Support & Resistance Analysis - Meta Platforms, Inc.
Based on the analysis, Meta Platforms, Inc. (META) has shown an interesting price pattern over the recent months. With technological innovations and a strong position in social media and virtual reality, the stock remains appealing to a wide range of investors. Careful examination of the trend and support & resistance levels provides insight into its potential future movements. Investors should remain vigilant to the signs of strength or weakness in the chart.
Trend Analysis
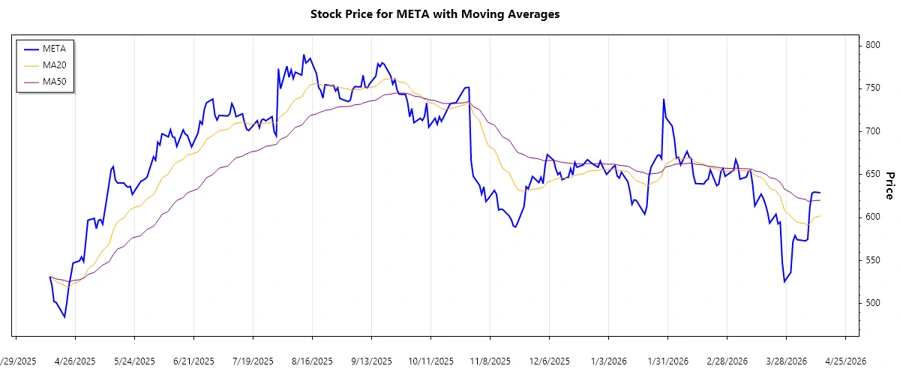
This section evaluates the closing prices of Meta Platforms, Inc. over the last few months to determine the prevailing trend. By calculating the EMA20 and EMA50 based on the provided closing prices, we can interpret the trend direction.
| Date | Closing Price | Trend |
|---|---|---|
| 2026-04-13 | 629.12 | ⚖️ |
| 2026-04-10 | 629.86 | ⚖️ |
| 2026-04-09 | 628.39 | ⚖️ |
| 2026-04-08 | 612.42 | ▼ |
| 2026-04-07 | 575.05 | ▼ |
| 2026-04-06 | 573.02 | ▼ |
| 2026-04-02 | 574.46 | ▼ |
Over the past week, the trend has remained flat with a slight downward inclination. The EMA20 is very close to the EMA50, indicating a lack of strong momentum in either direction. The short-term bearish indicators suggest careful observation should be maintained.
Support and Resistance
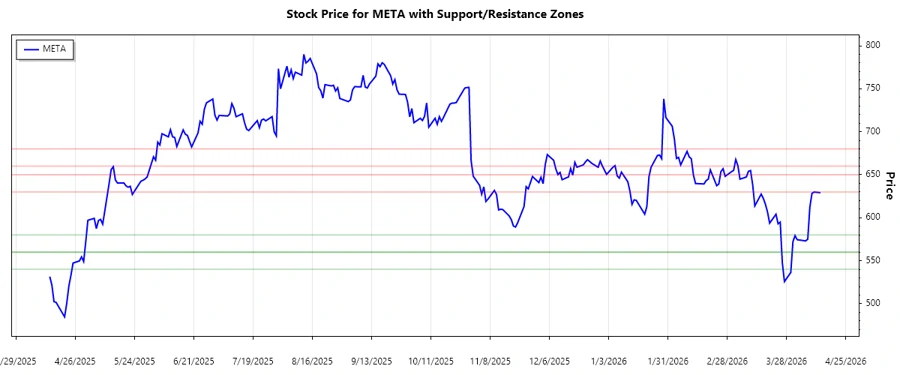
Identifying key support and resistance levels helps in understanding the potential range of price movements. The following levels have been calculated using recent closing prices:
| Zone Type | Range | Indicator |
|---|---|---|
| Support Level 1 | 560.00 - 580.00 | --- |
| Support Level 2 | 540.00 - 560.00 | 🔽 |
| Resistance Level 1 | 630.00 - 650.00 | ⬆️ |
| Resistance Level 2 | 660.00 - 680.00 | ⬆️ |
The current price suggests a proximity to the lower threshold of the primary resistance zone. If the price struggles to break above 630, traders might expect a potential pullback into the support region. Strict monitoring is necessary to manage risks efficiently.
Conclusion
In conclusion, Meta Platforms, Inc. is currently showing a neutral to slightly bearish trend. The market should be closely watched for any break above key resistance levels to confirm a bullish reversal. Nonetheless, a failure to maintain support could trigger a further downward movement. With robust fundamentals, long-term investors could still find potential opportunities, but cautious short-term trading approaches might yield better outcomes at this juncture.