August 18, 2025 a 02:03 pm
META: Trend and Support & Resistance Analysis - Meta Platforms, Inc.
Meta Platforms, Inc. has shown significant activity over the past months, reflecting its position as a leading innovator in social media and virtual reality markets. The company continues to expand its reach through strategic developments in its Family of Apps and Reality Labs segments. Investors have kept a close eye on its stock movement as market conditions evolve.
Trend Analysis
The analysis of Meta Platforms, Inc. (Ticker: META) based on recent closing prices suggests:
| Date | Close Price | Trend |
|---|---|---|
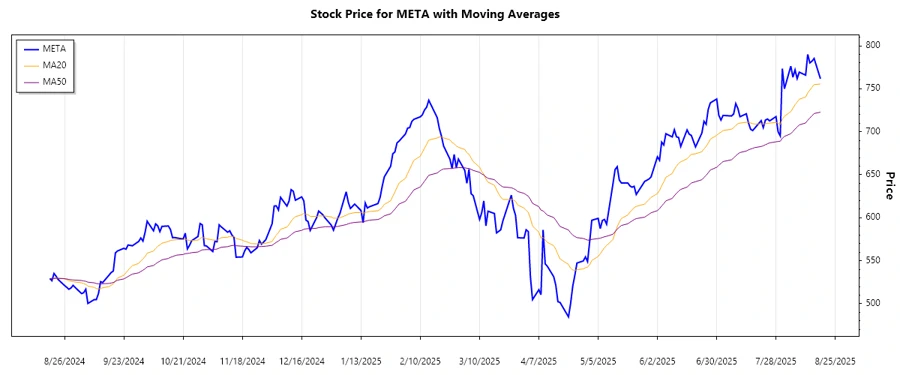
| 2025-08-18 | 761.675 | ▲ Up |
| 2025-08-15 | 785.23 | ▲ Up |
| 2025-08-14 | 782.13 | ▲ Up |
| 2025-08-13 | 780.08 | ▲ Up |
| 2025-08-12 | 790 | ▲ Up |
| 2025-08-11 | 765.87 | ▲ Up |
| 2025-08-08 | 769.3 | ▲ Up |
The calculated EMAs indicate that the short-term EMA20 is significantly higher than EMA50, suggesting a sustained upward trend for Meta Platforms' stock. This presents a positive signal for bullish investors.
Support and Resistance
Based on the closing prices analysis, the following key support and resistance zones have been identified:
| Zone Type | From | To |
|---|---|---|
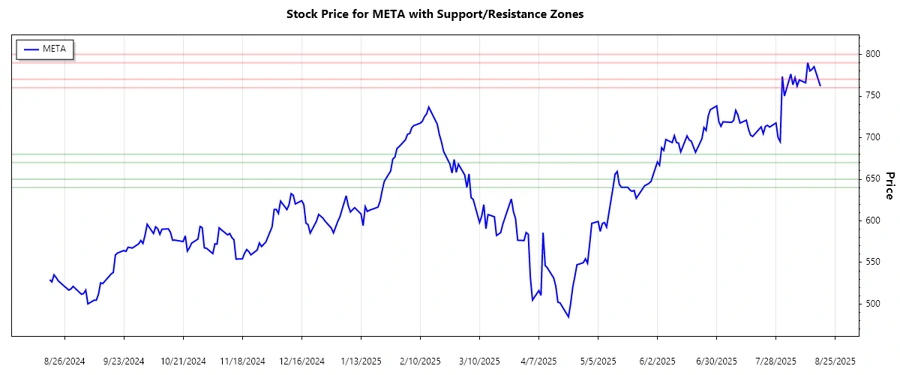
| Support | 670 | 680 |
| Support | 640 | 650 |
| Resistance | 790 | 800 |
| Resistance | 760 | 770 |
The current stock price of $761.675 is within the identified resistance zone of 760 to 770, indicating a potential barrier to further upward movement if it cannot be surpassed.
Conclusion
Meta Platforms, Inc. demonstrates a robust uptrend, ideal for bullish investors. However, market participants should be aware of resistance at current levels, which might limit rapid price increases. If the stock breaks through this resistance, it could potentially move towards the upper resistance zone around $790. Conversely, failing to maintain current levels may push it back into the support zones. Continued innovation and market share expansion remain META's driving factors, but external economic conditions pose risks as well.
Smart Data Insight
Master the Perfect Entry & Exit for this Stock
Don't leave your profits to chance. Historically, this stock follows specific seasonal patterns that institutional traders use to maximize returns.
- ✅ Identify the "Golden Buying Window"
- ✅ Avoid high-risk correction cycles
- ✅ Backtested data from the last 20+ years