July 20, 2025 a 08:15 am
MDT: Trend and Support & Resistance Analysis - Medtronic plc
Medtronic plc has demonstrated resilience in the fluctuating medical device market. Recent data indicates renewed investor confidence as the stock recovers to a more stable position. However, the balance between the company’s broad portfolio and market competitiveness requires close observation.
Trend Analysis
| Date | Closing Price | Trend |
|---|---|---|
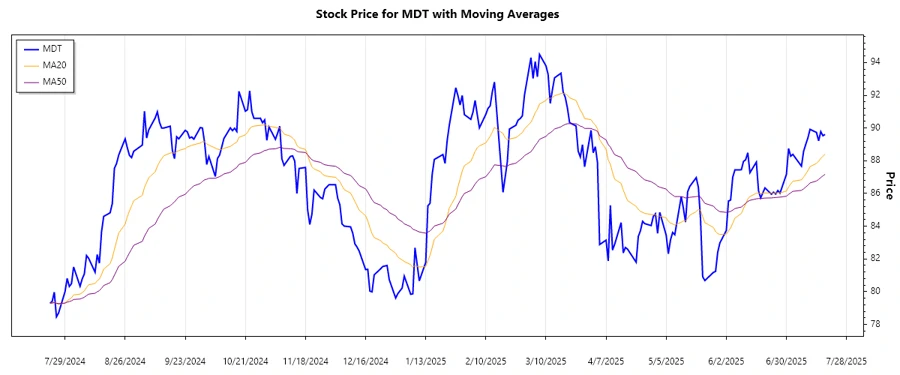
| 2025-07-18 | $89.61 | ▲ Bullish |
| 2025-07-17 | $89.53 | ▲ Bullish |
| 2025-07-16 | $89.78 | ▲ Bullish |
| 2025-07-15 | $89.22 | ▲ Bullish |
| 2025-07-14 | $89.73 | ▲ Bullish |
| 2025-07-11 | $89.92 | ▲ Bullish |
| 2025-07-10 | $89.40 | ▲ Bullish |
The latest data indicates a bullish trend, with EMA20 surpassing EMA50. This alignment suggests a potential continuation of upward momentum, posing opportunities for investors aiming for short-term gains.
Support- and Resistance Analysis
| Zone | From | To |
|---|---|---|
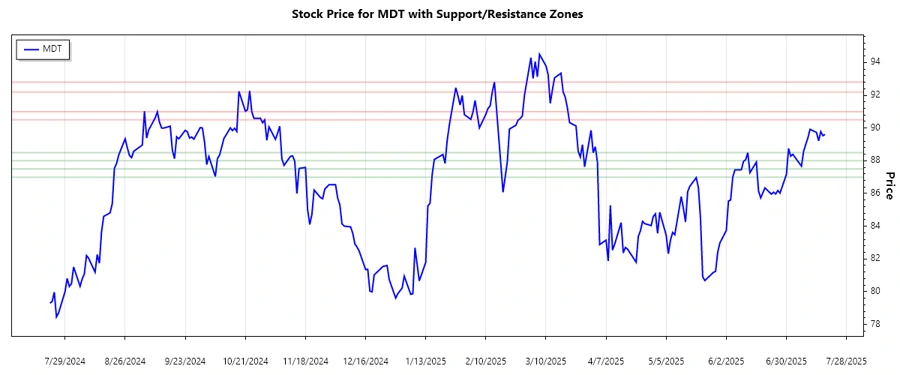
| Resistance 1 | 90.50 | 91.00 |
| Resistance 2 | 92.20 | 92.80 |
| Support 1 | 88.00 | 88.50 |
| Support 2 | 87.00 | 87.50 |
Currently, the stock price hovers around upper resistance zones, suggesting potential difficulty in breaking above unless further momentum is gained.
Conclusion
Medtronic plc's recent price activity shows strong upward potential, primarily supported by technical indicators such as moving averages and strong market demand. With current prices testing resistance levels, a successful breakout could signal further gains. However, investors should be cautious of potential reversals, especially in the event of a failed resistance breakthrough. While the company’s diverse healthcare offerings bolster its market position, external economic conditions and competitive pressures remain key risk factors.
Smart Data Insight
Master the Perfect Entry & Exit for this Stock
Don't leave your profits to chance. Historically, this stock follows specific seasonal patterns that institutional traders use to maximize returns.
- ✅ Identify the "Golden Buying Window"
- ✅ Avoid high-risk correction cycles
- ✅ Backtested data from the last 20+ years