March 07, 2026 a 06:44 am
MDT: Fibonacci Analysis - Medtronic plc
Medtronic plc, a leader in medical technology, has exhibited a significant price drop over the past months, indicative of a broader downward trend in the market. While its diversified portfolio serves as an anchor, sustaining investor interest, recent market conditions present challenges. The technical analysis reveals potential support levels, crucial for gauging future performance. Despite a current bearish sentiment, the company's innovations in healthcare technology may offer a silver lining for long-term stakeholders. Keeping a close watch on technical support levels could uncover strategic entry points.
Fibonacci Analysis
| Detail | Value |
|---|---|
| Trend Start Date | 2025-11-07 |
| Trend End Date | 2026-03-06 |
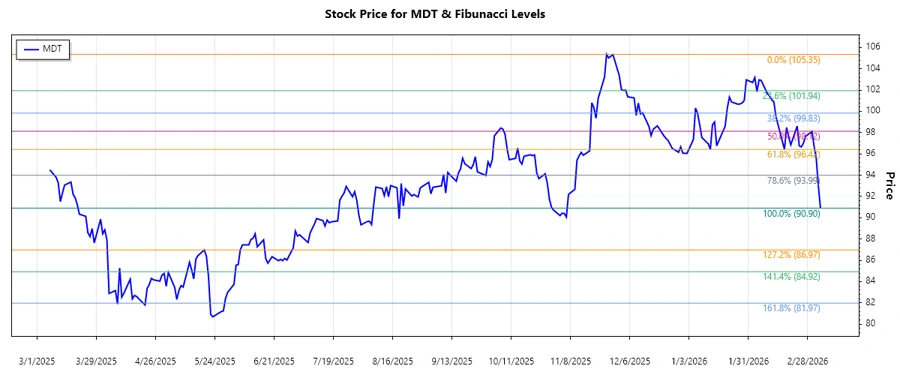
| High Point Price & Date | $105.35 on 2025-11-25 |
| Low Point Price & Date | $90.9 on 2026-03-06 |
| Fibonacci 0.236 | $94.87 |
| Fibonacci 0.382 | $97.38 |
| Fibonacci 0.5 | $98.79 |
| Fibonacci 0.618 | $100.21 |
| Fibonacci 0.786 | $102.15 |
| Current Price | $90.9 |
| Current Retracement Zone | Below 0.236 |
| Technical Interpretation | The current stock price of MDT is below the 0.236 Fibonacci level, indicating it may be in a continuation of its downtrend. The area around $94.87 (0.236 level) could serve as immediate resistance. |
Conclusion
The analysis of Medtronic plc reveals a prevailing downtrend from late 2025 to early 2026. Fibonacci retracement indicates potential resistance and support levels; however, the current price lies below the 0.236 level, suggesting a continuation of the downtrend. The stock may face pressure at this level before any bounce back. For investors, the $94.87 level is crucial for observing reversals. Although facing short-term bearish sentiment, Medtronic’s standing in the medical tech industry offers potential future gains. Cautious optimism is advised for potential investors.