June 25, 2025 a 03:15 pm

MDT: Fibonacci Analysis - Medtronic plc
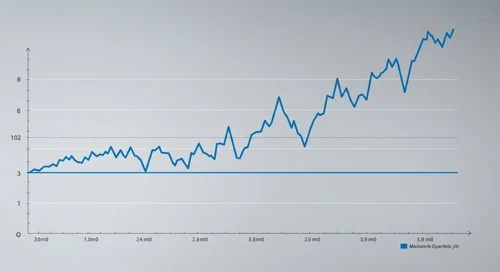
Medtronic plc is a key player in the medical devices market, showing a period of volatile price movements in recent months. The stock has experienced a challenging environment but remains resilient due to its strong portfolio and global presence. Recent price actions indicate a series of corrections and retracements that could offer appealing entry points for long-term investors. In technical terms, the stock should be closely monitored for key support and resistance levels following this analysis.
Fibonacci Analysis
| Detail | Information |
|---|---|
| Trend Start Date | 2025-03-17 |
| Trend End Date | 2025-06-25 |
| High Point Price (Date) | 93.35 (2025-03-17) |
| Low Point Price (Date) | 81.18 (2025-05-27) |
| Fibonacci Level 0.236 | 85.12 |
| Fibonacci Level 0.382 | 86.89 |
| Fibonacci Level 0.5 | 87.87 |
| Fibonacci Level 0.618 | 88.86 |
| Fibonacci Level 0.786 | 90.24 |
As of the current analysis, the stock's price is within the 0.236 Fibonacci retracement level, indicating potential support in this zone. This technical position suggests the stock may find stability and potentially bounce back from this level, signaling an opportunity for bullish investors if further upward movements persist.
Conclusion
Medtronic plc's recent price action analysis using Fibonacci retracement points to a potential stabilization period. Investors should be aware of both opportunities and risks, including market volatility and macroeconomic factors affecting the healthcare sector. While the stock's significant support near the 0.236 level provides promising prospects, caution is advised until a clear upward trend is established. The analysis is vital for making informed investment decisions and spotting potential entry or exit points. This technical structure might serve investors looking for stable plays in the medical devices industry.
Smart Data Insight
Master the Perfect Entry & Exit for this Stock
Don't leave your profits to chance. Historically, this stock follows specific seasonal patterns that institutional traders use to maximize returns.
- ✅ Identify the "Golden Buying Window"
- ✅ Avoid high-risk correction cycles
- ✅ Backtested data from the last 20+ years