June 03, 2026 a 07:46 am


MDT: Dividend Analysis - Medtronic plc
Medtronic plc showcases a stable dividend profile with a long-standing history of uninterrupted payments. With a dividend yield of 3.26% and a history spanning 45 years, this positions Medtronic as a potential candidate for income-seeking investors. However, the moderate growth rate necessitates an analysis of other financial metrics to ascertain the sustainability and potential for future increases.
📊 Overview
Medtronic operates within the Health Care sector, providing a stable dividend yield of 3.26%. The company currently dispenses 2.79 USD per share with a robust dividend history extending over 45 years, highlighting its commitment to returning value to shareholders. Importantly, the firm has avoided any recent cuts or suspensions, indicating a reliable income stream.
| Metric | Value |
|---|---|
| Sector | Health Care |
| Dividend yield | 3.26% |
| Current dividend per share | 2.79 USD |
| Dividend history | 45 years |
| Last cut or suspension | None |
📈 Dividend History
Medtronic has consistently rewarded its shareholders with increasing dividends, which underscores its financial resilience and commitment to shareholders. Such a record contributes positively to investor confidence, making it an attractive proposition in the market.
| Year | Dividend per Share (USD) |
|---|---|
| 2026 | 0.71 |
| 2025 | 2.83 |
| 2024 | 2.79 |
| 2023 | 2.75 |
| 2022 | 2.67 |
📉 Dividend Growth
The modest but continuous enhancement in dividends over the three and five-year periods suggests a steady growth trajectory. This gradual appreciation is pivotal for long-term investors seeking both income and growth potential as it signals consistent financial health and operational efficiency.
| Time | Growth |
|---|---|
| 3 years | 1.96% |
| 5 years | 4.42% |
The average dividend growth is 4.42% over 5 years. This shows moderate but steady dividend growth.
✅ Payout Ratio
Payout ratios offer critical insights into the sustainability of a company's dividend payments. A 77.57% EPS-based payout ratio and a 66.25% FCF-based ratio indicate a relatively high but still manageable dividend payout, suggesting cautious optimism provided earnings and cash flows remain stable.
| Key figure | Ratio |
|---|---|
| EPS-based | 77.57% |
| Free cash flow-based | 66.25% |
The payout ratios reflect an above-average distribution of profits, which may limit future raises but remain tenable under current profit levels, underscoring Medtronic's capacity to maintain its dividend strategy.
📊 Cashflow & Capital Efficiency
Evaluating cash flow efficiency and capital allocation is fundamental for assessing a company's ability to cover dividends and reinvest for growth. Medtronic's solid free cash flow yield and operating cash flow ratios demonstrate effective financial oversight and fiscal prudence.
| Metric | 2023 | 2024 | 2025 |
|---|---|---|---|
| Free Cash Flow Yield | 5.71% | 4.91% | 4.79% |
| Earnings Yield | 4.88% | 3.47% | 4.31% |
| CAPEX to Operating Cash Flow | 25.74% | 23.38% | 26.39% |
| Stock-based Compensation to Revenue | 1.27% | 1.21% | 1.28% |
| Free Cash Flow / Operating Cash Flow Ratio | 73.61% | 76.62% | 73.61% |
Medtronic's strategic management of its capital and cash flow ensures continued financial health and supports ongoing dividend payments, striking a balance between rewarding investors and positioning for future opportunities.
📈 Balance Sheet & Leverage Analysis
Understanding leverage is pivotal in determining a company's risk and ability to meet obligations. Medtronic's debt metrics reflect moderate leverage, suggesting judicious use of debt to finance its operations without overextending financially.
| Metric | 2023 | 2024 | 2025 |
|---|---|---|---|
| Debt-to-Equity | 0.47 | 0.50 | 0.59 |
| Debt-to-Assets | 0.27 | 0.28 | 0.31 |
| Debt-to-Capital | 0.32 | 0.33 | 0.37 |
| Net Debt to EBITDA | 2.62 | 2.89 | 2.88 |
| Current Ratio | 2.39 | 2.03 | 1.85 |
| Quick Ratio | 1.81 | 1.55 | 1.42 |
| Financial Leverage | 1.77 | 1.79 | 1.91 |
The firm's manageable leverage ratios indicate robust financial stability, ensuring adequate liquidity and capability to service debt, thus protecting shareholder interests and enhancing investor appeal.
✅ Fundamental Strength & Profitability
Profitability metrics such as ROE and ROA provide insight into the firm's efficiency in generating profits. Medtronic's returns on equity and assets underscore a proficient use of equity financing and effective management of its asset base.
| Metric | 2023 | 2024 | 2025 |
|---|---|---|---|
| Return on Equity | 7.30% | 7.32% | 9.71% |
| Return on Assets | 4.13% | 4.09% | 5.09% |
| Margins: Net | 12.03% | 11.36% | 13.90% |
| EBIT Margin | 19.21% | 17.17% | 18.96% |
| EBITDA Margin | 27.85% | 25.35% | 27.49% |
| Gross Margin | 65.67% | 65.34% | 65.52% |
| Research & Development to Revenue | 8.63% | 8.45% | 8.81% |
Medtronic's strong margin profile reflects robust profitability, supporting its ability to maintain competitive R&D spending, which is crucial for sustained innovation and market leadership.
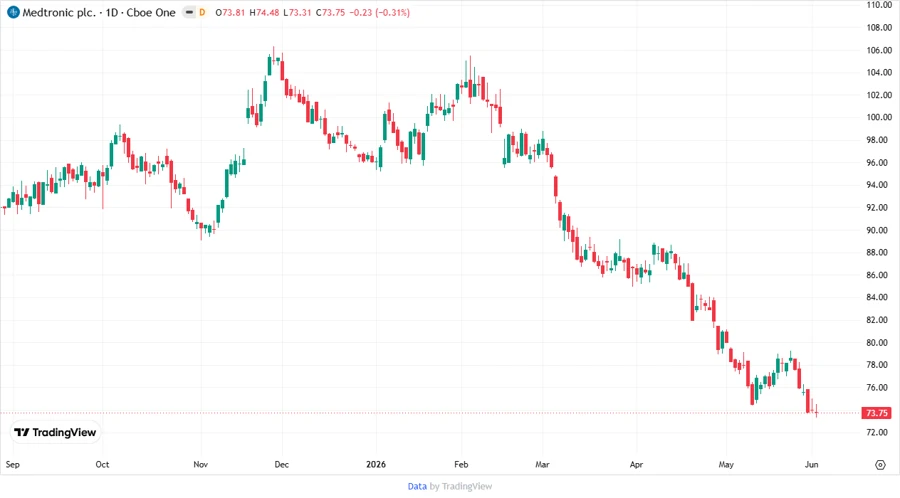
📈 Price Development
🗣️ Dividend Scoring System
| Category | Score | Rating |
|---|---|---|
| Dividend yield | 4 | |
| Dividend Stability | 5 | |
| Dividend growth | 3 | |
| Payout ratio | 3 | |
| Financial stability | 4 | |
| Dividend continuity | 5 | |
| Cashflow Coverage | 4 | |
| Balance Sheet Quality | 5 |
Overall Score: 33/40
⚠️ Rating
Medtronic's overall dividend profile is robust, rendering it an appealing option for those seeking a combination of stability and modest growth in dividend income. The balance between its sustainable payout ratios, strong revenue profiles from disciplined cash flow management, and commendable financial stability reinforces its attractiveness. Thus, Medtronic is a favorable buy for dividend-centric portfolios.
Smart Data Insight
Master the Perfect Entry & Exit for this Stock
Don't leave your profits to chance. Historically, this stock follows specific seasonal patterns that institutional traders use to maximize returns.
- ✅ Identify the "Golden Buying Window"
- ✅ Avoid high-risk correction cycles
- ✅ Backtested data from the last 20+ years