May 23, 2026 a 07:31 am
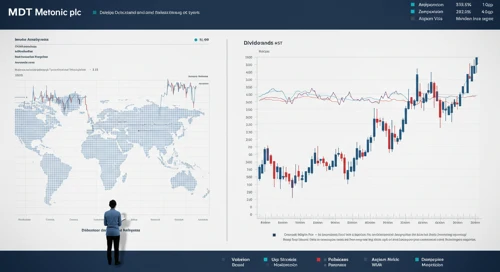
MDT: Dividend Analysis - Medtronic plc
Medtronic plc demonstrates a strong commitment to dividend payments, offering a consistent dividend yield that attracts income-focused investors. With a history of 45 consecutive years of dividend payments and moderate growth, its dividends are a reliable source of income. The company's recent performance shows a solid market position, yet the high payout ratio suggests cautious optimism is advised.
📊 Overview
Medtronic plc operates in the healthcare sector, providing a competitive dividend yield and demonstrating a strong track record of dividend history.
| Metric | Value |
|---|---|
| Sector | Healthcare |
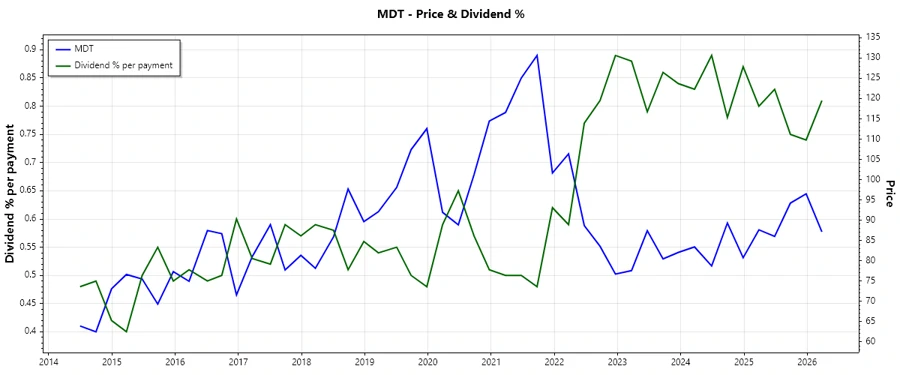
| Dividend yield | 3.26 % |
| Current dividend per share | 2.79 USD |
| Dividend history | 45 years |
| Last cut or suspension | None |
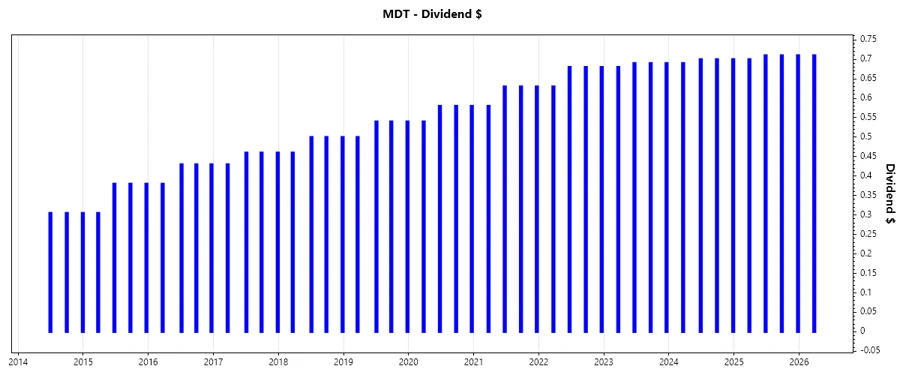
📉 Dividend History
A robust dividend history underpins investor confidence and signals a commitment to shareholder returns.
| Year | Dividend Per Share (USD) |
|---|---|
| 2026 | 0.71 |
| 2025 | 2.83 |
| 2024 | 2.79 |
| 2023 | 2.75 |
| 2022 | 2.67 |
📈 Dividend Growth
A vital indicator of financial health, dividend growth showcases a company’s ability to increase payouts over time, reflecting profitability and operational effectiveness.
| Time | Growth |
|---|---|
| 3 years | 1.96 % |
| 5 years | 4.42 % |
The average dividend growth is 4.42 % over 5 years. This shows moderate but steady dividend growth.
🔍 Payout Ratio
The payout ratio is critical in evaluating how much of the company's earnings are allocated to dividends, essential for assessing sustainability and future growth prospects.
| Key figure | Ratio |
|---|---|
| EPS-based | 77.57 % |
| Free cash flow-based | 66.25 % |
The EPS payout ratio of 77.57 % and FCF payout ratio of 66.25 % suggest that a significant portion of earnings and cash flows are directed towards dividend payouts, indicating a mature but potentially constrained growth environment.
💰 Cashflow & Capital Efficiency
Understanding cash flow dynamics and capital efficiency is pivotal for determining a company’s ability to sustain dividends and reinvest for future growth.
| Metric | 2025 | 2024 | 2023 |
|---|---|---|---|
| Free Cash Flow Yield | 4.79 % | 4.91 % | 3.79 % |
| Earnings Yield | 4.31 % | 3.47 % | 3.11 % |
| CAPEX to Operating Cash Flow | 26.39 % | 23.38 % | 24.16 % |
| Stock-based Compensation to Revenue | 1.28 % | 1.21 % | 1.14 % |
| Free Cash Flow / Operating Cash Flow Ratio | 73.61 % | 76.62 % | 75.84 % |
Cash flows display consistent coverage of operating expenses and dividends, with capital efficiency ratios reflecting prudent capital allocation strategies despite inherent sector challenges.
🏦 Balance Sheet & Leverage Analysis
Evaluating financial leverage and liquidity provides insights into a company's risk profile and flexibility in servicing debt while funding growth and returning capital.
| Metric | 2025 | 2024 | 2023 |
|---|---|---|---|
| Debt-to-Equity | 0.59 | 0.50 | 0.47 |
| Debt-to-Assets | 0.31 | 0.28 | 0.27 |
| Debt-to-Capital | 0.37 | 0.33 | 0.32 |
| Net Debt to EBITDA | 2.88 | 2.89 | 2.62 |
| Current Ratio | 1.85 | 2.03 | 2.39 |
| Quick Ratio | 1.42 | 1.55 | 1.81 |
| Financial Leverage | 1.91 | 1.79 | 1.77 |
Balance sheet metrics indicate a stable leverage profile and strong liquidity ratios, underpinning the company’s resilience to economic cycles and ability to capitalize on investment opportunities.
📌 Fundamental Strength & Profitability
Core profitability metrics highlight management efficiency and operational effectiveness in driving return on investments and market competitiveness.
| Metric | 2025 | 2024 | 2023 |
|---|---|---|---|
| Return on Equity | 9.71 % | 7.32 % | 7.30 % |
| Return on Assets | 5.09 % | 4.09 % | 4.13 % |
| Net Margin | 13.90 % | 11.36 % | 12.03 % |
| EBIT Margin | 18.96 % | 17.17 % | 19.21 % |
| EBITDA Margin | 27.49 % | 25.35 % | 27.85 % |
| Gross Margin | 65.32 % | 65.34 % | 65.67 % |
| Research & Development to Revenue | 8.13 % | 8.45 % | 8.63 % |
The strong profitability ratios reinforce Medtronic's robust market position and efficient management, supporting sustained dividend growth and competitive returns on investment.
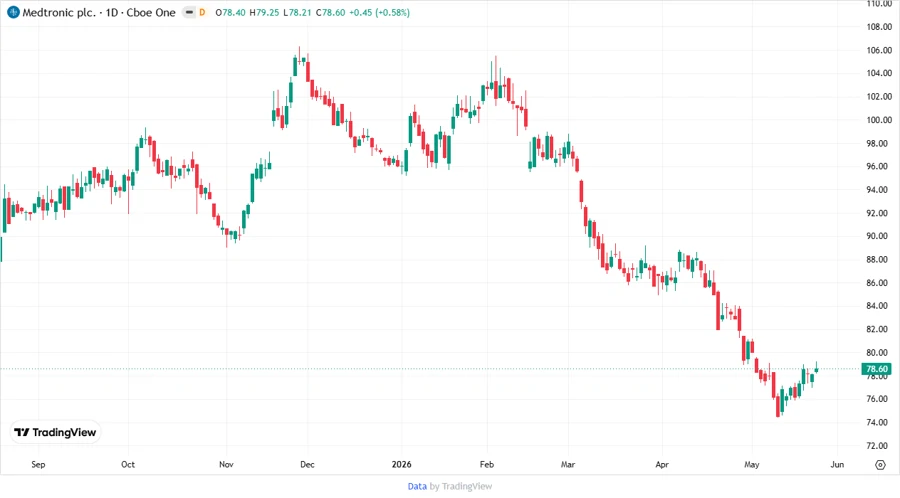
📈 Price Development
🏅 Dividend Scoring System
| Category | Score | |
|---|---|---|
| Dividend yield | 4 | |
| Dividend Stability | 5 | |
| Dividend growth | 3 | |
| Payout ratio | 3 | |
| Financial stability | 4 | |
| Dividend continuity | 5 | |
| Cashflow Coverage | 4 | |
| Balance Sheet Quality | 5 |
Total Score: 33/40
🗣️ Rating
Medtronic plc is a strong contender for dividend investors who value stability and reliable income. While growth is moderate, the solid financial metrics suggest a robust ability to maintain and potentially increase dividends. Consider this stock as a core holding in a diversified income-focused portfolio.
Smart Data Insight
Master the Perfect Entry & Exit for this Stock
Don't leave your profits to chance. Historically, this stock follows specific seasonal patterns that institutional traders use to maximize returns.
- ✅ Identify the "Golden Buying Window"
- ✅ Avoid high-risk correction cycles
- ✅ Backtested data from the last 20+ years