May 19, 2026 a 02:46 am


MDT: Dividend Analysis - Medtronic plc
🗣️ Medtronic plc stands as a noteworthy player in the medical devices sector, showcasing a consistent dividend history over 45 years. With a dividend yield of 3.26%, it offers a compelling choice for income-focused investors. However, the relatively high EPS payout ratio of 77.57% warrants a closer look to ensure sustainability amidst economic fluctuations.
Overview 📊
The following table provides a snapshot of Medtronic's dividend profile:
| Sector | Dividend Yield | Current Dividend per Share | Dividend History | Last Cut or Suspension |
|---|---|---|---|---|
| Medical Devices | 3.26% | 2.79 USD | 45 years | None |
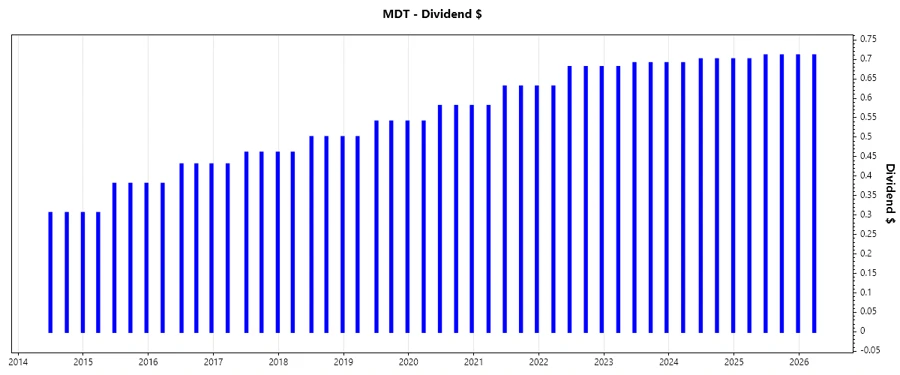
Dividend History 📈
Medtronic's robust dividend history highlights its commitment to shareholders. Maintaining dividends for 45 years signifies strong financial health and stability. Below is a chart illustrating recent payments:
| Year | Dividend per Share (USD) |
|---|---|
| 2026 | 0.71 |
| 2025 | 2.83 |
| 2024 | 2.79 |
| 2023 | 2.75 |
| 2022 | 2.67 |
Dividend Growth 📉
Growth trends provide insights into a company's potential for continued dividend increases, which can enhance long-term value for shareholders. Below is a table showing Medtronic's dividend growth:
| Time | Growth |
|---|---|
| 3 years | 1.96% |
| 5 years | 4.42% |
The average dividend growth is 4.42% over 5 years. This shows moderate but steady dividend growth.
Payout Ratio ✅
Understanding payout ratios is vital to evaluate the sustainability of dividends. High ratios suggest potential pressure on the company to maintain dividends during downturns.
| Key Figure | Ratio |
|---|---|
| EPS-based | 77.57% |
| Free cash flow-based | 66.25% |
With 77.57% (EPS) and 66.25% (FCF), Medtronic's payout ratios indicate a strong commitment to return cash to shareholders, yet leave less room for maneuver during financial adversity.
Cashflow & Capital Efficiency 💼
Analyzing cash flow and capital efficiency metrics provides light on return potentials and the operational robustness of a company.
| Metric | 2023 | 2024 | 2025 |
|---|---|---|---|
| Free Cash Flow Yield | 3.79% | 4.91% | 4.79% |
| Earnings Yield | 3.11% | 3.47% | 4.31% |
| CAPEX to Operating Cash Flow | 24.16% | 23.38% | 26.39% |
| Stock-based Compensation to Revenue | 1.14% | 1.21% | 1.28% |
| Free Cash Flow / Operating Cash Flow Ratio | 75.84% | 76.62% | 73.61% |
Medtronic shows favorable cash flow stability and effective capital utilization, underpinned by consistent free cash flow and earnings yields.
Balance Sheet & Leverage Analysis 📉
The financial structure, reflected in balance sheet metrics, is crucial for assessing how leverage might impact overall financial stability.
| Metric | 2023 | 2024 | 2025 |
|---|---|---|---|
| Debt-to-Equity | 47.32% | 49.83% | 59.38% |
| Debt-to-Assets | 26.79% | 27.81% | 31.10% |
| Debt-to-Capital | 32.12% | 33.26% | 37.26% |
| Net Debt to EBITDA | 2.62 | 2.89 | 2.87 |
| Current Ratio | 2.39 | 2.03 | 1.85 |
| Quick Ratio | 1.81 | 1.55 | 1.42 |
| Financial Leverage | 1.77 | 1.79 | 1.91 |
Medtronic maintains sound financial stability with adequate coverage through its leverage and liquidity measures, though monitoring is advised as leverage ratios subtly rise.
Fundamental Strength & Profitability 💡
Evaluating profitability and the efficacy of management's investment approach offers insight into potential growth and expansion capabilities.
| Metric | 2023 | 2024 | 2025 |
|---|---|---|---|
| Return on Equity | 7.30% | 7.31% | 9.71% |
| Return on Assets | 4.13% | 4.09% | 5.09% |
| Net Margin | 12.03% | 11.36% | 13.90% |
| EBIT Margin | 19.21% | 17.17% | 18.96% |
| EBITDA Margin | 27.85% | 25.35% | 27.48% |
| Gross Margin | 65.67% | 65.34% | 65.32% |
| R&D to Revenue | 8.63% | 8.45% | 8.14% |
With impressive gross margins and healthy ROE, Medtronic's profitability metrics suggest robust operational efficiency and effective management strategies.
Price Development 💹
Dividend Scoring System 🔍
| Criteria | Score (1 to 5) | Score Bar |
|---|---|---|
| Dividend yield | 4 | |
| Dividend Stability | 5 | |
| Dividend Growth | 3 | |
| Payout ratio | 3 | |
| Financial stability | 4 | |
| Dividend continuity | 5 | |
| Cashflow Coverage | 4 | |
| Balance Sheet Quality | 4 |
Total Score: 32/40
Rating 🌟
Medtronic plc presents itself as a reliable choice for dividend-seeking investors with stable dividend history and robust financial indicators. However, cautious monitoring is advised due to elevated payout ratios and rising leverage, aligning risk with consistent income-generation potential.
Smart Data Insight
Master the Perfect Entry & Exit for this Stock
Don't leave your profits to chance. Historically, this stock follows specific seasonal patterns that institutional traders use to maximize returns.
- ✅ Identify the "Golden Buying Window"
- ✅ Avoid high-risk correction cycles
- ✅ Backtested data from the last 20+ years